


I’ve been obsessing over this Coal chart for the last few months watching this healthy consolidation take shape. I first pointed out this development in March, and although we were up a few percentage points since then, it wasn’t really until last week that we finally got going. The bigger the base, the stronger the breakout tends to be. In the case of coal, we had 4 months of a tight consolidation. I love that.
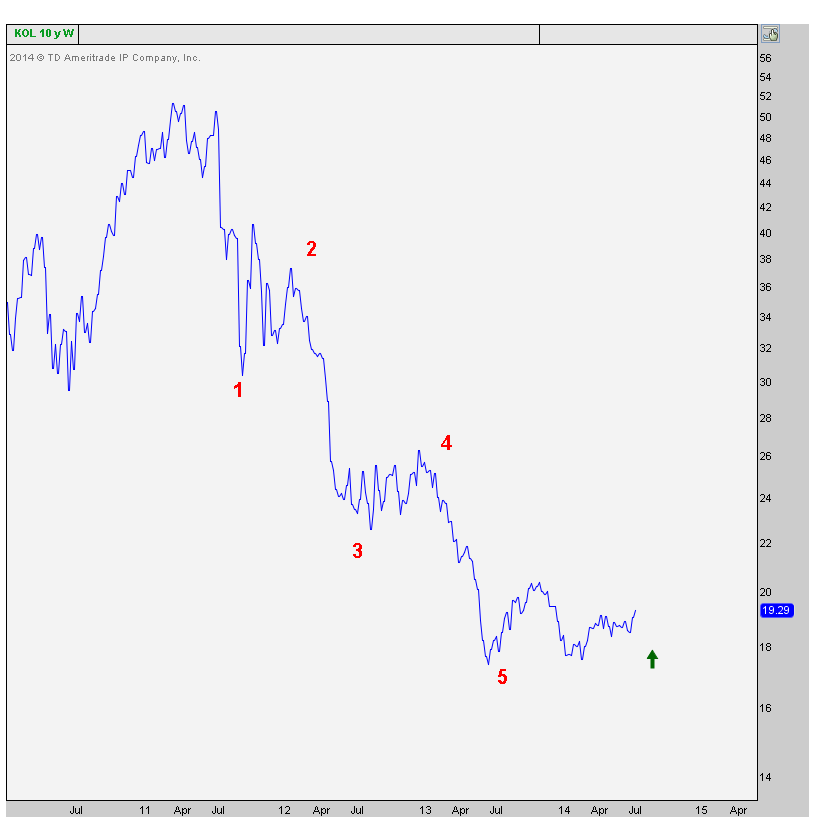
Just to review what’s just occurred, let’s go over the thought process behind the trade. The first thing that stands out is the overwhelming anecdotal evidence of hatred towards the coal stocks. Who’s pounding the table on Coal? Very few if any. Second of all, I’m not a pure Elliottician, far from it, but I’m not blind to a beautiful five wave pattern either. We have that here in $KOL and often times a solid bounce develops from the end of a 5-wave move like this. The 3-of-3 is text book:
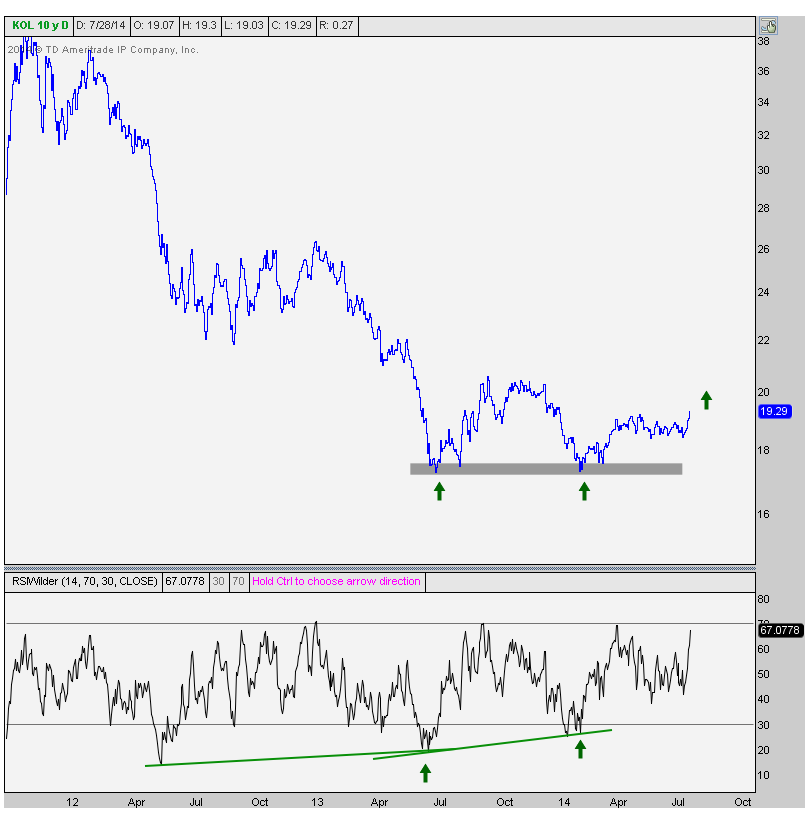
So Elliott wave tells me to pay attention and sentiment says to pay attention. Okay, now you have my attention. What is momentum doing? Well, here is the daily chart of KOL showing a massive bullish divergence developing. This is not just at last summer’s low, but once again on the retest of that low earlier this year. Some might even call this a double bottom, but that won’t be confirmed until we take out 20.50, which are last Septembers highs. So although not really relevant yet, the potential is certainly there:
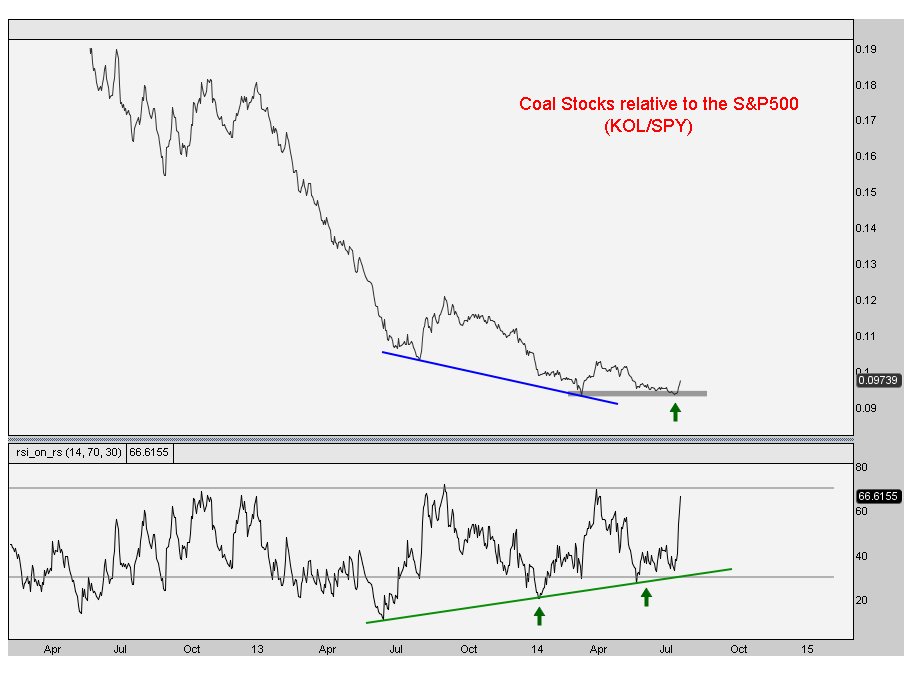
Wow, so momentum looks great. Is the relative strength also improving? Not only is it improving, but we have bullish divergences in momentum on the relative strength daily chart as well as the weekly. That combination reminds a lot me of Apple’s epic top in September 2012; we had the same thing. Look at this weekly chart of KOL/SPY showing the improvement in relative strength:
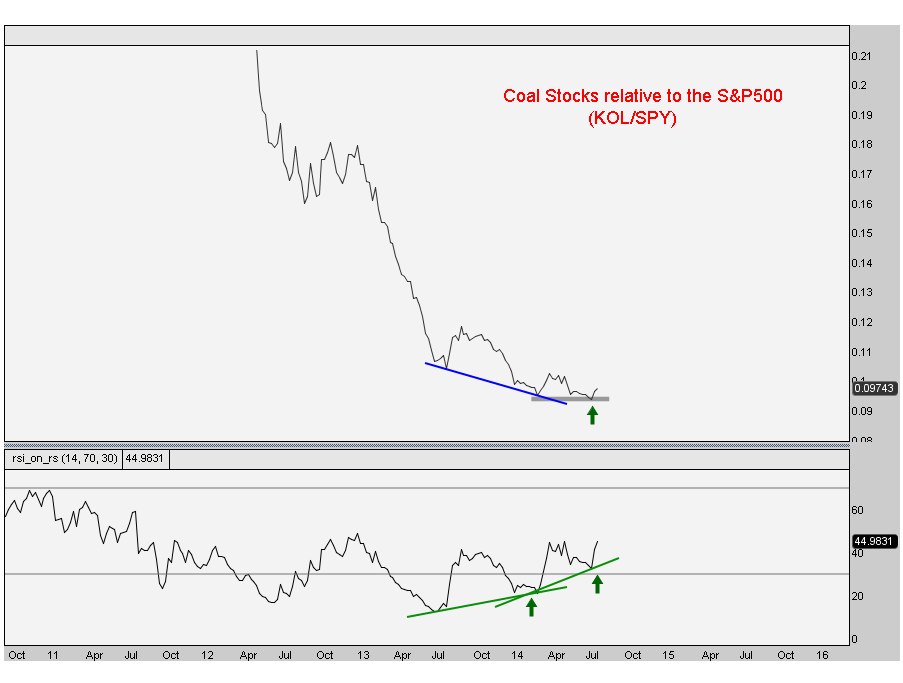
Now look at the daily chart. Nice right?
Check. Check. Check. Check. Now what? We wanted to see a breakout in price right? Well we just got it:
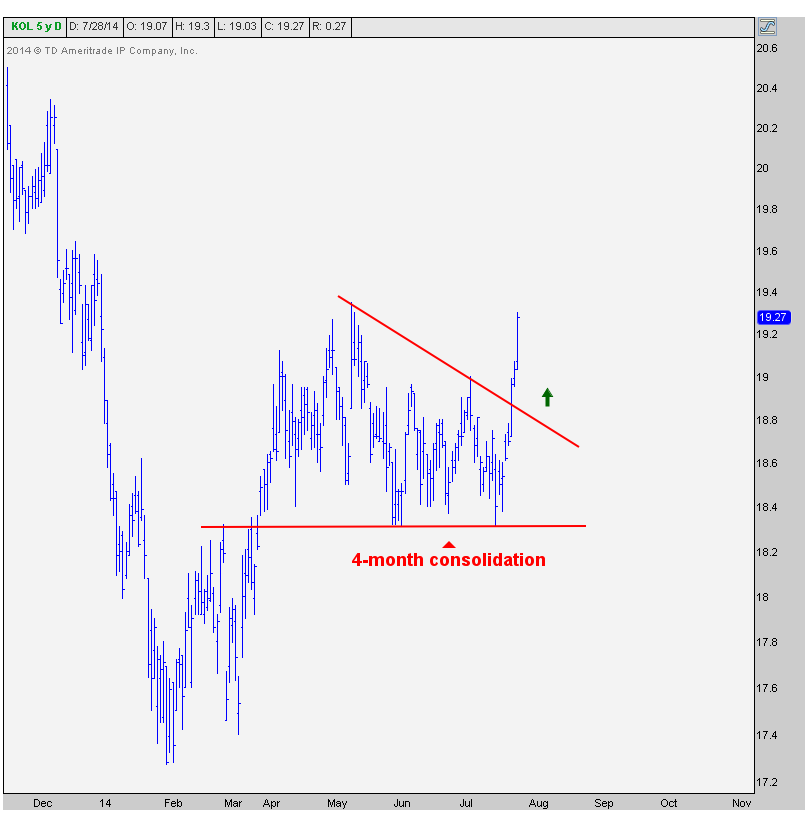
Looks great to me. We only want to be long above this 4-month consolidation. If it falls back into it, then the chart is not as clean. I only like clean charts. Funny we’re talking about coal in this way, the dirtiest of energy sources.
Love it. The first target is $26; the highs from 2012, which in my opinion was wave 4 of the 5-wave declined that first got my attention. Take a look at the $KOL holdings and there are some more interesting setups in there as well. Look at a name like $CLF where 35% of the float is short, it has a 10 day short ratio, and only 4 of the 24 sell side analysts who cover it have a buy recommendation on it. We really love that. Do a little homework and you’ll probably find more of them in a similar situation.
I think this is a great example of incorporating many of our tools to come to form conclusion. I know I’ve mentioned this trade a few times recently, but figured that going over the entire thought process could add some value. I hope I accomplished that.
Go get ‘em!
***
REGISTER HERE for more information on how to access these price and relative strength charts for all sub-sectors on a weekly basis.
Tags: $KOL $SPY $CNX $JOY $WLT $ACI $CLF
Full Disclosure: Nothing on this site should ever be considered to be advice, research or an invitation to buy or sell any securities, please see my Terms & Conditions page for a full disclaimer.


