


Investors can’t say definitively that the price of oil bottomed in the third week of March, but some very recent data released by the International Energy Agency (IEA) that supports the premise that a bottom is in. More on that in a moment.
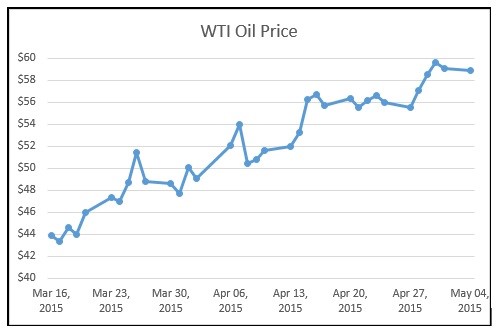
From a low near $43 per barrel WTI has been bumping around $60 per barrel this past week–a not insignificant increase of 40% over only a fifty day period of time.
Source of data: www.eia.gov
As investors we need to try and figure out if this is a short term head fake or something that is sustainable and based on supply and demand fundamentals.
A Rally Despite Repeatedly Bearish American Inventory Numbers
The oil data point that is most closely watched on a weekly basis by oil traders is the Wednesday EIA inventory report.
Week after week in 2015–up until the most recent (May 6) report–these inventory numbers have been unquestionably bearish.
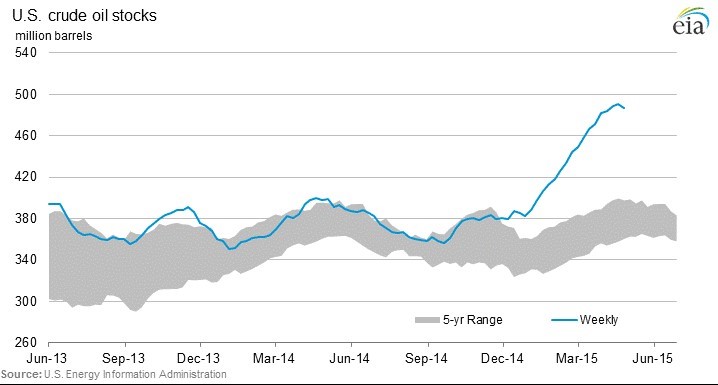
U.S. inventory levels aren’t just high relative to the trailing five year range, they are off-the-charts-high. When oil was in its mid-collapse stage in December 2014 inventory levels were still within that five year range.
Today those inventory levels sit 100 million barrels above the highest level of the past five years experienced at this time of year.
Looking at this inventory chart in isolation would make you think that oil prices should have been driven right into the ground. Inventory levels are so high that there is talk from respectable sources that we may actually run out of places to put the stuff.
This is bearish on a level that we haven’t seen before.
Yet oil has rallied. Why?
The most recent monthly Oil Market Report from the IEA provides a few clues–clues that I have been writing about in recent weeks.
On April 14th I wrote a story entitled “Surprise, Global Oil Demand is Surging…” and focused on the data that was available both in the United States as well as in China and India.
The IEA’s April Oil Market Report which was released to the public this week confirms exactly what I wrote about nearly a month ago.
The IEA appropriately describes what is happening at “The Plot Thickens”.
The IEA notes that there has been unexpected demand strength across the globe. Why there wouldn’t be a positive demand reaction from a 50% decline in oil prices may be a bit perplexing to some, but nonetheless.
According to the IEA global year on year demand for oil increased by a “surprising” 1.3 million barrels per day year on year in the first quarter of 2015.
The demand charge was particularly strong in Asia with deliveries of oil rising by 110,000 barrels per day in Korea, 200,000 barrels per day in India and 250,000 barrels per day in China.
The IEA noted that even Russia which is subject to punishing economic sanctions was able to grow its oil consumption in the first quarter.
The inventory chart referred to earlier with inventory levels that were completely off the charts presented an incredibly bearish picture for oil.
The demand side of the equation has a similar looking chart, but one that is decidedly bullish.
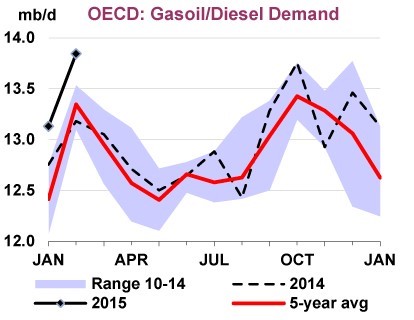
Source of Chart: April 2015 IEA Monthly Oil Market Report
This chart depicts OECD gasoil/diesel demand for the first two months of 2015. Like the inventory chart, monthly oil demand is far above the five year average and range.
For the first time in four years OECD demand has grown for four consecutive months. Now that we are through refinery maintenance season and refining levels are higher we should see this demand growth show up in the inventory levels.
There was a reason that oil prices bottomed in March and started to rise despite continued bearish inventory data.
The Market figured out that oil demand was also soaring and I suspect also that it determined (also accurately) that U.S. production was flattening and heading into a decline.
If that trend continues, oil price and oil stocks could end up surprising everyone this year. There are six stocks that I think outperform the Market if this trend continues.
At the end of 2015, don’t look back thinking I wish I would have known what those stocks were. You get to see them and read about them RISK FREE click right HERE.


