


By Frank Holmes
CEO and Chief Investment Officer
U.S. Global Investors

First it was the U.S. Federal Reserve. Then, in 2013, Japan launched what became known as Abenomics. The European Central Bank (ECB) followed suit in 2014. And now the People’s Bank of China has joined the parade.
All of them in some way stimulated economic growth by initiating monetary quantitative easing (QE) programs.
The media and politicians applauded them for their QE plans. All of them, that is, except for China. Instead, we’ve only seen a flurry of negative headlines.
I often tell investors to follow the money, which currently is cheap to borrow. Cheap money is good for stock prices, but not for retired folks who have most of their savings in term deposits with low interest yields.
Most important for commodity investors is the powerful correlation between China’s money supply and commodity prices. The money supply peaked in 2011 and has been falling along with commodity prices.
On Monday, China unexpectedly trimmed the value of its currency, the renminbi, 2 percent, the most in two decades. In the days since, many analysts and “experts” have irrationally turned sour on China, similar to the extreme bearishness toward gold in the last month.
But investors this week came home to the yellow metal after China announced it had increased its gold reserves by an additional 19 tonnes in July, boosting its total holdings to 1,677 tonnes (nearly 54 million ounces). This helped prices rally 1.4 percent on Wednesday to reach $1,124.46, a three-week high.
Investors should likewise return to China when they realize that the global reaction to the renminbi devaluation has been hugely overblown. I agree entirely with my friend Addison Wiggins, who writes in his Daily Reckoning newsletter:
The market is up in arms about this currency move. And frankly most things that I read from the market have it all wrong…
They make China out to be the big, bad villain—calling this move manipulation or a “currency war.” And while EVERYTHING that central banks do is indeed manipulation or a “currency war”—why don’t we hear those terms thrown around the ECB or the U.S. Fed?
To help cut through the noise and get a more balanced picture of its causes, effects and possible ramifications, I chatted with our resident Asia expert Xian Liang, portfolio manager of our China Region Fund (USCOX). Below are some of the highlights.
As you know, we follow currencies very closely in our investment team meetings because we’re aware that government policy is a precursor to change. Having said that, why did China decide to devalue the renminbi?
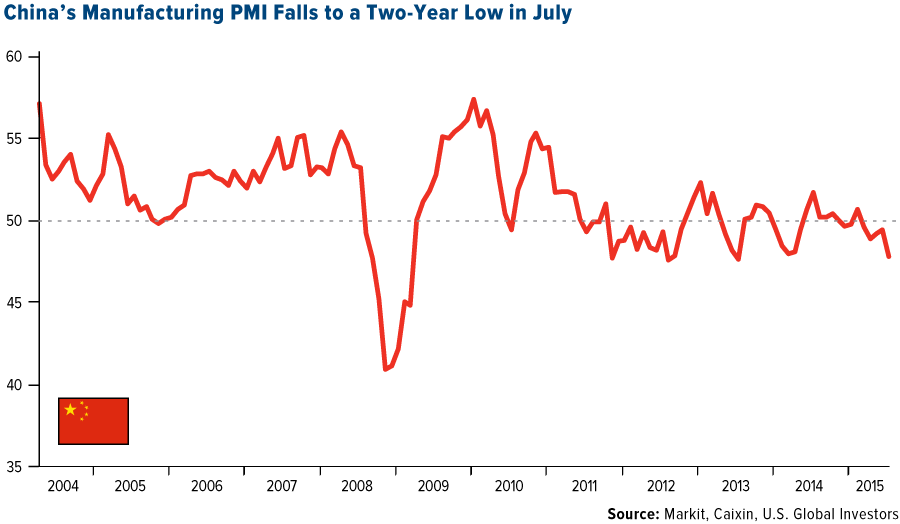
There are several possible reasons, the first one being economics—specifically, to stimulate economic growth and ease liquidity in the financial sector. A weaker renminbi can help make Chinese exports cheaper for foreigners and imports dearer for locals, creating the incentive for a “net inflow” of money. July data shows that economic activity remains worse than expected. China’s purchasing managers’ index (PMI) reading for the month is one example, but fixed-asset investments, power generation and exports were all down.
Deflationary pressure also intensified in July, and the renminbi in trade-weighted terms—that is, against a whole basket of major trading partners’ currencies, not just the dollar—has soared to record highs. This is because of a de facto peg to the dollar, making Chinese goods and services uncompetitively priced to world customers.
Another reason is domestic politics. Chinese policymakers want to resurrect their reformist image among domestic intellectuals and the middle class by yielding more power to market forces to determine its currency exchange rate, which offers some compensation for July’s aggressive, command-and-control intervention in the A-Share market.
And then there’s international politics. It’s well known that China wishes its currency to be included in the International Monetary Fund’s special drawing rights basket, along with the U.S. dollar, euro, British pound and Japanese yen. Chinese policymakers are actively demonstrating to the IMF their commitment to “a more market-determined exchange rate,” a critical step toward eventual renminbi internationalization.
Many countries have devalued their currencies lately—Japan, Germany, France and others. Business Insider, in fact, just shared a Goldman Sachs chart showing how miniscule the renminbi’s depreciation really is compared to other emerging countries’ currencies. And yet China gets singled out in the media! Why is everyone so hard on China?

What’s usually not mentioned in all the news and editorials we’ve seen this week is that China hasn’t resorted to currency devaluation in 20 years. For the last decade, the renminbi was largely moving in a single direction—up—because China was tired of being dubbed a currency manipulator and it would like to foster consumerism.
As the second-largest economy in the world, China is interested in transforming its growth model from investment-driven to consumer-driven, and some investors might wonder how the devaluation will affect consumption. Today, the richer Chinese middle class is made up of big spenders, both home and abroad, and a weaker renminbi translates to weaker purchasing power for them. It might also have larger implications for global tourism, global consumer goods and global property. So the difference between China and, say, France is pretty significant.

A lot of people think the Federal Reserve will hike interest rates this year—maybe even as early as September—though I’ve expressed doubts about that. Will the devaluation have any effect on the Fed’s decision?
To the extent that it weakens its own currency, China exports deflation to the U.S. and can help the dollar’s strength. Lower inflation and a stronger dollar reduce the incentive or rationale for any imminent Fed rate hike. So yes, you can almost say this is China’s silent protest against the widely anticipated September hike. China seems to be reminding Janet Yellen that in today’s interconnected world, unilateral monetary policy action by the U.S. without first considering global dynamics might not be the smartest thing to do. In effect, it’s saying: “Here’s a preview of what could happen if you insist on hiking rates this year.”
Is this a sign of further reforms? What else can we expect?
The devaluation does indeed herald back to the days of major Chinese reform. In fact, it occurred one day after China approved a comprehensive plan to reform its state-owned enterprises to make them more market-driven, similar to those in Singapore. So at least the government welcomes the perception that the devaluation has more to do with long-term structural reform and less to do with short-term expediency.
Investors are being bombarded with bad news about China right now. There have been some very negative headlines. Where’s the good news in all this?
Here’s the simple answer: A weaker currency not only helps Chinese exporters but also U.S. consumers. Whether you buy things made in China or are planning your next vacation there, you’ve got money to save now. Opportunities have also been expanded for U.S. retailers and manufacturers that source from China, not to mention U.S. airlines. And if you’re in the camp that believes this devaluation is the start of a new “currency war,” then it might be time for gold to shine.
Gold’s Safe Haven Status Never Disappeared
 |
Indeed, gold tends to benefit the most when there are global currency fluctuations. This week was no exception, as the metal had its best week since June. Many analysts, it seems, prematurely declared that gold has lost its safe haven status because it fell to five-year lows during the height of Greece’s and Puerto Rico’s debt crises.
But as I explained last month, gold is behaving this way not because it’s lost anything. Instead, there are external forces at work here, including the strong U.S. dollar, fears of rising interest rates and a slowing global economy, not to mention possible price manipulation. Despite these powerful headwinds, gold managed to hold strong last week as media giants’ stock plummeted, erasing $60 billion in stock value.
Speaking of gold and mining, I’ll be in Lima, Peru during the first week in November to attend the Mining & Investment Latin America Summit, where I’m scheduled to deliver the opening keynote address. I’ll be speaking on mining around the world, macro trends and opportunities and challenges in the upcoming year. For those of you interested in attending, you can register here. I’d love to see you there!
Airports Get over a Quarter Million Views!
As you might imagine, I spend a lot of time in jets and airports. Last year I took over 100 flights, and this year it looks as though I’ll take just as many, if not more. I’m not the only one, as Airlines for America, an industry trade group, estimates that 222 million passengers will have flown on U.S. carriers this summer. It’s for this reason we created a colorful slideshow that celebrates the eight busiest airports in the world. As of this writing, it’s been viewed on Business Insider over 264,000 times! Check out the slideshow for yourself and then share with us your favorite airport story.

Index Summary
- The major market indices finished up this week. The Dow Jones Industrial Average rose 0.60 percent. The S&P 500 Stock Index climbed 0.67 percent, while the Nasdaq Composite gained 0.09 percent. The Russell 2000 small capitalization index was up 0.48 percent this week.
- The Hang Seng Composite fell 1.94 percent this week; while Taiwan fell 1.62 percent and the KOSPI lost 1.33 percent.
- The 10-year Treasury bond yield increased 4 basis points to 2.2 percent.
Domestic Equity Market
Strengths
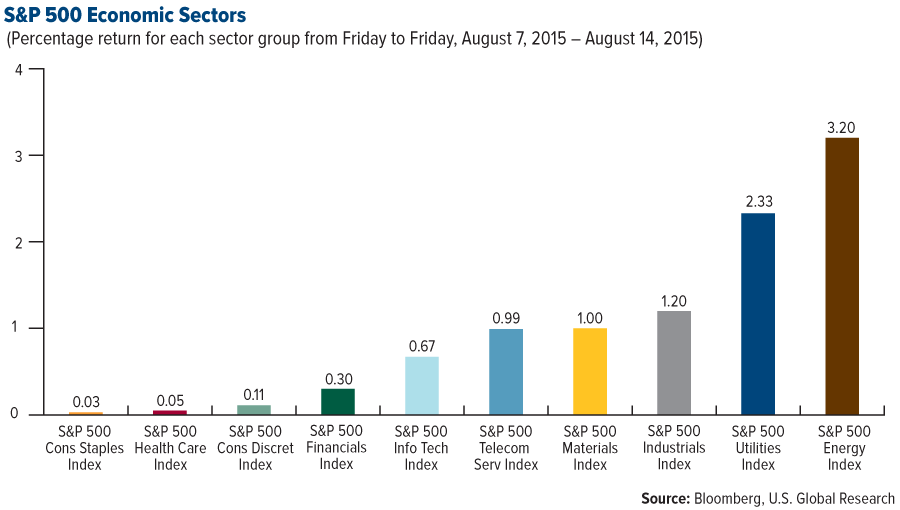
- Despite lower crude oil prices this week, energy stocks recovered from an oversold condition and outperformed the broader market. The S&P 500 Energy Index gained 3.2 percent in the period.
- Utilities continued to outperform the market this week as the yield on 10-year government notes remains below 2.25 percent. The S&P 500 Utilities Index rose 2.3 percent this week.
- Industrials posted a positive return during the week even with weak economic growth reports from China. The S&P 500 Industrials Index gained 1.2 percent in the period.
Weaknesses
- The health care sector faded from recent leadership this week and was the worst performer in the S&P 500 Index. The S&P 500 Health Care Index was flat on the week.
- Consumer staples stocks also underperformed after recent leadership, with Keurig Green Mountain and Mead Johnson Nutrition leading this week’s decline. The S&P 500 Consumer Staples Index was also flat for the week.
- Consumer discretion stocks were the third worst performing sector in the S&P 500 this week as many companies within the media industry looked to recover prior gains. The S&P 500 Consumer Discretion Index returned 0.11 percent on the week.
Opportunities
- Empire Manufacturing data is expected next week and is forecast to increase by 5 percent, up from 3.8 percent in the prior month.
- The Housing Starts are out next week and are expected to reach 1.19 million units, up from 1.17 million from the prior month.
- The Philadelphia Federal Reserve outlook will be released next week, with expectations for an increase to 6.8 percent from 5.7 percent.
Threats
- Falling commodity prices and weak government long-term yields are perhaps a reflection of building disinflationary pressures, which would be a negative sign for economic growth.
- China released weak economic numbers this week that highlighted the country’s decision to devalue the yuan. A further slowdown could spill over into the domestic economy and negatively impact equity markets.
- The Fed’s impending rate hike next month could prove premature, which would cause further strength in the U.S. dollar, thus weakening exports and domestic GDP.

The Economy and Bond Market
Global stocks endured a tough week, with European stocks faring the worst, shaken by China's surprise currency devaluation and the Eurozone's disappointing economic growth. U.S. data were largely positive, however. The yield on the 10-year U.S. Treasury note stood at 2.20 percent Friday. U.S. West Texas Intermediate crude oil fell below $42 per barrel Friday, its lowest price since March 2009, before recovering slightly, while Brent crude futures traded just above $49 per barrel. Declining Chinese demand compounded concerns of oversupply.
Strengths
- Retail sales added 0.6 percent month-over-month in July, up from 0.0 percent month-over-month in June (revised up from a 0.3 percent month-over-month decline initially) and in line with market expectations. Excluding autos, retail sales added 0.4 percent month-over-month in July, unchanged from growth in June (revised up from a 0.1 percent month-over-month decline initially) and in line with expectations of 0.4 percent month-over-month. Retail sales have improved meaningfully after the weak start to the year. Even in the face of lower gasoline prices, consumers were hesitant in the beginning of the year. Since the spring, sales have been on a higher trend, pointing to roughly 3.0 percent real consumer spending growth on an annualized basis. Overall, the activity data – retail sales, job growth, and home sales – are pointing to a modest expansion. From the Fed’s perspective, the real side of the economy is on track, consistent with forecasts and supportive of the beginning of a hiking cycle. The concern comes from the stubbornly low inflation trajectory.
- Business inventories increased 0.8 percent month-over-month in June, up from 0.3 percent month-over-month in the prior month and above the expected 0.3 percent month-over-month.
- Industrial production surged 0.6 percent month-over-month in July, coming in well above expectations of 0.3 percent month-over-month. With strong production, capacity utilization was boosted to 78 percent from 77.7 percent, rebounding to April levels. Manufacturing was the big driver, up 0.8 percent, as auto production surged 10.6 percent.
Weaknesses
- Prices for imported goods fell 0.9 percent from June to July as oil prices declined and a strong U.S. dollar exerted downward pressure. Import prices fell 10.4 percent from a year earlier, with the cost of imported petroleum 5.9 percent below June's price and down 43.4 percent from July 2014. Declining prices could get worse given China’s devaluation. This continued downtrend in prices raises concerns about deflation in the economy.
- While second quarter profits rose by 1.2 percent year-over-year, aggregate revenue growth is contracting, with four out of the 10 major sectors showing declines. The rising dollar and slowing global growth momentum remain headwinds to foreign earnings (approximately 45 percent of overall S&P 500 profits).
- Survey data of U.S. small businesses suggest that profit margins are on the verge of an important squeeze. This week’s release of the U.S. National Federation of Independent Business (NFIB) small business survey revealed that most of the components of the survey are below their May readings, suggesting that the U.S. economy is struggling to gain traction. From an equity perspective, the most troubling aspect of the survey is the message from the small business profit margin proxy, which is based on the number of respondents planning to raise selling prices as well as their intentions to raise compensation. This has served as a good proxy for U.S. profit margins, since labor is the most significant cost to U.S. small businesses. The data showed businesses will have a very big challenge to keep margins up in the current pricing environment.
Opportunities
- A solid labor market coupled with low borrowing costs should continue to underpin U.S. housing activity this year. The NAHB homebuilders survey will be released on Monday, followed by housing starts on Tuesday.
- With the looming rate hike by the Federal Reserve, a spike in the VIX and bond volatility related to "policy error" fears would push corporate bond spreads even wider, but would also support the long end of the government bond curves in safe-haven countries like the U.S. and Germany.
- Fed policymakers could take a pass on a September interest-rate hike, if it appears the People’s Bank of China’s yuan devaluation is a regime change and not a one-off to weaken the peg to the U.S. dollar.
Threats
- Creditors are demanding higher risk premiums to finance the business sector and given that they rank ahead of equities in the capital structure, it may only be a matter of time before shareholders demand a higher risk premium. As evidenced by the advance/decline line, credit spreads are widening across industries and are not just a reflection of the slump in the oil path. Widening spreads are most likely a reaction to the deflationary impact of the surging U.S. dollar, especially at a time when the corporate sector has leveraged up to pursue M&A and share buybacks.

- If consensus views buy into the Fed’s rate hike, the short-term outlook calls for higher global yields in the near term, driven by a hawkish repricing of the U.K. and U.S. money market curves.
- All of the gains in the S&P 500 so far this year are attributable to only two industries: health care and retail. More than half of S&P 500 stocks, and over 70 percent of Russell 2000 stocks, are down 10 percent or more from their peak. Meanwhile, the ratio of margin debt-to-GDP has surpassed the levels observed just before the 2000 and 2007 peaks. Rising rates, a stronger dollar, stretched valuations, and slowing earnings growth are all likely to weigh on U.S. equities.

Gold Market
For the week, spot gold closed at $1,114.95 up $21.04 per ounce, or 1.91 percent. Gold stocks, as measured by the NYSE Arca Gold Miners Index, gained 7.92 percent. The U.S. Trade-Weighted Dollar Index lost 1.01 percent for the week.
| Date | Event | Survey | Actual | Prior |
|---|---|---|---|---|
| Aug -11 | Germany ZEW Survey Current Situation | 64.2 | 65.7 | 63.9 |
| Aug -11 | Germany ZEW Survey Expectations | 31.9 | 25 | 29.7 |
| Aug -12 | China Retail Sales YoY | 10.60% | 10.50% | 10.60% |
| Aug -13 | Germany CPI YoY | 0.20% | 0.20% | 0.20% |
| Aug -13 | U.S. Initial Jobless Claims | 270K | 274K | 270K |
| Aug -14 | Eurozone CPI Core YoY | 1.00% | 1.00% | 1.00% |
| Aug -14 | U.S. PPI Final Demand YoY | -0.90% | -0.80% | -0.70% |
| Aug -18 | U.S. Housing Starts | 1180K | -- | 1174K |
| Aug -19 | U.S. CPI YoY | -0.20% | -- | -0.10% |
| Aug -20 | U.S. Initial Jobless Claims | 272K | -- | 274K |
Strengths
- China devalued the yuan by the most in two decades as policymakers stepped up efforts to introduce more market-based reforms. China’s exporters have been hurt by keeping the yuan pegged to the dollar. The new policy spooked markets, prompting fears of a currency war with their Asian rivals. Gold, in response, climbed to a three-week high.
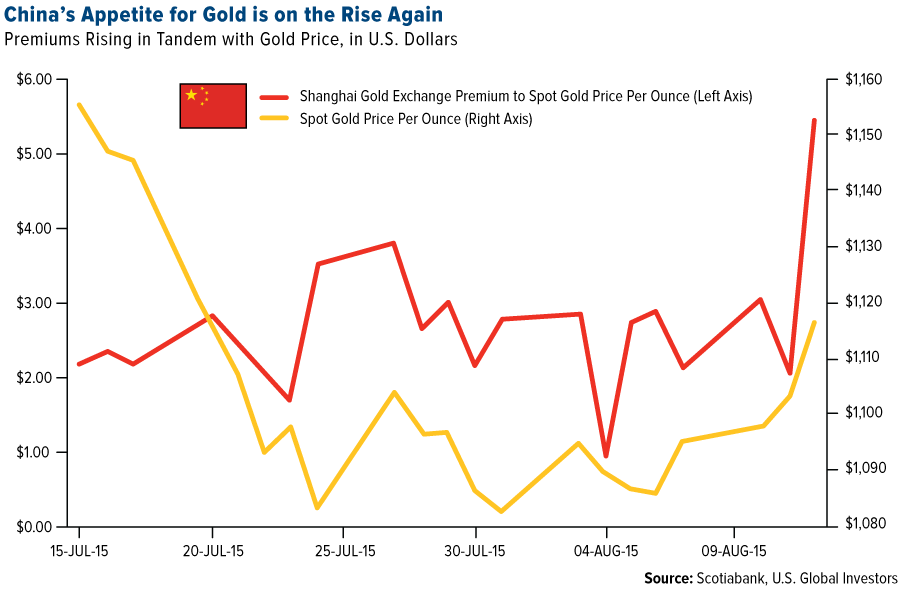
- Gold withdrawals from the Shanghai Gold Exchange this year so far have totaled a massive 1,464 tons, which is running around 116 tons ahead of the record 2013 year at the same time and 370 tons ahead of the 2014 figure. If the average monthly withdrawal level for the current year keeps up we will be looking at annual withdrawal totaling more than 2,500 tons. With Chinese demand trending to be strongest in the last four months of the year this level could indeed be achieved. In the first six months of the year, gold production in China jumped 8 percent year-over-year, further cementing China’s dominant position in the sector. Additionally, in what could be a new trend towards more transparency as it pushes for the yuan’s inclusion in the IMF’s currency basket, China disclosed its monthly gold purchases for July. It increased its reserves by 1.1 percent, rising to 53.93 million ounces. That pace of purchases would put it at a rate of 240 tons per year, ahead of prior years’ pace of 100 tons per year.
- While gold seems to be falling out of favor amid a looming rise in U.S. interest rates, Germany’s Commerzbank has advised investors to hold on to the precious metal rather than sell it. The bank said gold has already hit a low and the expected announcement will not affect it much. Additionally, gold promises more stability than the Euro currency thanks to the loose monetary of the European Central Bank.
Weaknesses
- According to a report by the World Gold Council, demand for gold shrank to the lowest in six years last quarter as buyers in China and India, the two biggest markets, saw incomes fall as a result of a volatile stock market in China and a weak harvest in India. However, central banks remained net buyers, increasing purchases by 11 percent from the previous quarter. That’s their eighteenth consecutive quarter of purchases and the World Gold Council sees them buying 400 to 500 tons by the end of the year.
- While the finance ministry’s draft released in May would let banks set the interest rate on gold lending, it doesn’t adequately allow them to hedge their exposure, according to the managing director of MMTC-PAMP India Pvt. That’s because banks will have to hold onto small deposits of as little as 30 grams and pay interest to customers until they accumulate a large enough amount to pass onto jewelers.
- Piling on the bearish sentiment for gold, UBS cut its one-month gold forecast by 13 percent to $1,050/oz, with the key driver being the possible interest rise in the U.S. Further, according to analysts at Oversea-Chinese Banking Corp., Itau Unibanco and Barclays, the recent rally in gold will crumble as investors move past the yuan drop and focus on the Federal Reserve’s plan for raising interest rates.
Opportunities
- Underscoring the risk of competitive devaluations stemming from China’s currency devaluation move, traders are now pricing in about a 40 percent chance the Fed will raise interest rates at its September meeting. That’s down from 54 percent on August 7. Over the last month, liquidations from gold ETFs have surged. However, the news from China did trigger net purchases in the past week.

- Gold speculators and futures traders added to their bullish gold positions last week following five weeks of declines. As shown in the price oscillator chart below, gold was significantly oversold. Ironically, for all the negativity that some brokers prognosticate on the woes of owning gold, it was reported on August 6 that both Goldman Sachs and HSBC took large gold deliveries of 3.2 tons and 3.9 tons, respectively. In both cases, the purchases were registered as being for the benefit of the bank’s own house account, rather than the accounts of customers.

- According to the World Gold Council, gold consumers in India are expected to increase purchases for festivals in the second half of the year since the metal has become cheaper. In addition, we are coming into a seasonal window of price strength in gold as fall approaches.
Threats
- Goldman Sachs believes that while appreciation pressure on the dollar and the pound may delay “lift-off,” both central banks will ultimately have to accept stronger currencies given how far below neutral their policy rates are. Thus, Goldman Sachs has reiterated a call for the dollar to rise 20 percent and the British pound 12 percent in the next three years.
- The Oversea-Chinese Banking Corp. believes that when the Federal Reserve raises rates it should translate into a firmer dollar, sending gold toward $1,050/oz.
- The two biggest unions at South African gold mining companies have said that wage negotiations have broken down, bringing the industry closer to a strike.

Energy and Natural Resources Market
Strengths
- Gold stocks led natural resources this week as China’s weakening of the yuan raised concern of widespread currency devaluations. The NYSE Arca Gold Miners Index gained 7.9 percent this week.
- Oil and gas refining stocks continued to outperform following strong second-quarter earnings reports and favorable margins. The S&P 500 Oil Refining Index rose 4.5 percent this week.
- After weeks of underperformance, MLPs outperformed as investors were less confident of a Fed rate hike next month in light of weakening global growth, thus boosting equity bond proxies. The Alerian MLP Index gained 5.1 percent in the period.
Weaknesses
- Disappointing growth in China weighed on dry bulk shipping as fixed asset investment continues to slow. The Bloomberg Dry Shipping Index fell 3.6 percent during the week.
- Copper and other base metals stocks pulled back as investors continue to fear a slowdown in China, the leading commodity consumer. The S&P/TSX Capped Diversified Metals and Mining Index fell 4.4 percent this week.
- Despite a rebound in domestic oil and gas producing companies this week, TSX listed energy stocks lagged the broader North American energy complex. The S&P/TSX Capped Energy Index fell 0.60 percent during the week.
Opportunities
- Recent money flows out of energy ETFs have reached extreme levels that usually typifies selling exhaustion, which could lead to a share price rebound for the depressed sector.

- China's gold demand this year is expected to at least hold steady with last year and will not likely be dented by this week's currency devaluation, the World Gold Council said. Yuan-denominated gold prices in China, the world's top consumer of the metal, spiked nearly 6 percent this week, boosted in part by investors seeking a secure store of value.
- Oil’s slump makes crude so attractive to China that even the biggest drop in its currency since 1994 probably won’t deter its ambition to build supplies, according to Energy Aspects Ltd., KBC Advanced Technologies and Nomura Holdings Inc.
Threats
- Crude oil made a new 52-week low this week, and could fall further given high inventories and resilient U.S. production that remains elevated despite a lower rig count and softer prices.
- Concerns over China’s slowing growth rate remain elevated following this week’s data. Commodities and related stocks should be cautiously monitored.
- The Fed has all but said for certain that it will raise rates this year, which could further strengthen the U.S. dollar. If this becomes consensus thinking, precious metals stocks could give back recent gains.
August 13, 2015Will a Democrat Win the White House in 2016? |
August 10, 2015Gold Holds Its Own Against These Media Darlings |
August 6, 2015What Airlines Can Teach the Energy Sector about Adversity |
Emerging Markets
Strengths
- Greece's parliament approved the new €85 billion ($95 billion) bailout agreement Friday, hours before European finance ministers were to meet and likely endorse the deal. With the deal calling for more austerity and higher taxes, the vote deepened divisions in the ruling anti-austerity Syriza party and could lead to early elections.
- Mexico's peso bounced off record lows after the central bank vowed to sell at least $8.6 billion of dollar-denominated currency reserves and raised the prospect of pre-emptive rate hikes to ward off speculators.
- Eastern European economies are resisting the global emerging market slump, with the region’s bonds gaining and currencies outperforming as investors shift out of those countries more reliant on China and commodities. The divergence shows how countries such as Hungary, Romania, the Czech Republic, and Poland are providing a haven for some investors after China’s devaluation of the yuan roiled the markets of export-dependent nations. Most of the countries in the eastern European block are net importers of oil, rely more on Germany than China for trade and are protected by the European Central Bank’s quantitative easing program from the worst effects of likely U.S. interest rate increases.
Weaknesses
- The People's Bank of China acted to devalue the renminbi three days in a row, signaling that a weaker, market-driven exchange rate may help to boost exports and prop up China's sluggish economy. Currencies of other Asian countries sold off to keep their exports competitively priced. Commodity prices and global stock prices fell in response to the unexpected action.
- Russia's gross domestic product contracted 4.6 percent in the second quarter from a year earlier. This was the Russian economy's weakest quarter since 2009, as the decline in global oil prices has dragged the oil-exporting country into a deeper recession.
- China's imports declined 8.1 percent and exports fell 8.3 percent in July from a year earlier. Producer prices contracted 5.4 percent year-over-year.
Opportunities
- While the 3 percent voluntary depreciation of the Chinese renminbi against the U.S. dollar this week took world markets by surprise, China’s move did not deviate from its strategic commitment to making its currency value more market oriented ahead of President Xi Jinping’s state visit to the U.S. in September and the IMF’s decision whether to add the Chinese currency to its reserve basket. A weaker renminbi should help alleviate intensifying deflationary pressure in domestic China and benefit local companies with low foreign currency denominated debt and solid export business.

- The Chinese devaluation increases the chances of a “currency war” which would mean more support from central banks for the markets, a positive for equities. It would reduce the likelihood of fast interest rate increases in countries such as the U.S. and increase the chance of more dovish central bank action in Europe.
- According to the manager of Fidelity’s Latin America Fund, Brazil presents a great opportunity to pick up quality assets. While in the short term things may get worse before they get better, on a three to five year view the outlook is more optimistic given that the government structure has improved with the minister of finance and central bank now more orthodox in their policies. If the government continues the plan to reduce subsidies to various sectors in the economy and create a more market-based cost of capital, they would be very positive structural changes longer term.
Threats
- A weaker Chinese currency against the Hong Kong dollar, which remains pegged to the U.S. dollar, might only add salt to the wound for Hong Kong’s property, retail, and hotel sectors, as over 60 percent of Hong Kong’s tourist arrivals are from mainland China and tourism contributes about 13 percent of Hong Kong’s GDP.
- The renminbi has stabilized for now. Should the rennimbi resume depreciating it would increase global deflationary forces.
- Greece faces two years of recession amid sharp budget cuts and overhauls mandated by its bailout agreement, European Union officials said. The country’s economy is expected to shrink 2.3 percent this year because of the recent months of turmoil and the cuts required by the bailout. Next year, it is projected to contract 1.3 percent.
Leaders and Laggards
| Index | Close | Weekly Change($) |
Weekly Change(%) |
|---|---|---|---|
| DJIA | 17,477.40 | +104.02 | +0.60% |
| S&P 500 | 2,091.54 | +13.97 | +0.67% |
| S&P Energy | 506.05 | +15.70 | +3.20% |
| S&P Basic Materials | 286.35 | +2.84 | +1.00% |
| Nasdaq | 5,048.24 | +4.69 | +0.09% |
| Russell 2000 | 1,212.69 | +5.79 | +0.48% |
| Hang Seng Composite Index | 3,284.75 | -65.08 | -1.94% |
| Korean KOSPI Index | 1,983.46 | -26.77 | -1.33% |
| S&P/TSX Canadian Gold Index | 130.30 | +9.58 | +7.94% |
| XAU | 49.71 | +4.01 | +8.77% |
| Gold Futures | 1,114.60 | +20.50 | +1.87% |
| Oil Futures | 42.15 | -1.72 | -3.92% |
| Natural Gas Futures | 2.81 | +0.01 | +0.43% |
| 10-Yr Treasury Bond | 2.20 | +0.04 | +1.66% |
| Index | Close | Monthly Change($) |
Monthly Change(%) |
|---|---|---|---|
| DJIA | 17,477.40 | -572.77 | -3.17% |
| S&P 500 | 2,091.54 | -15.86 | -0.75% |
| S&P Energy | 506.05 | -31.28 | -5.82% |
| S&P Basic Materials | 286.35 | -15.36 | -5.09% |
| Nasdaq | 5,048.24 | -50.71 | -0.99% |
| Russell 2000 | 1,212.69 | -51.83 | -4.10% |
| Hang Seng Composite Index | 3,284.75 | -126.79 | -3.72% |
| Korean KOSPI Index | 1,983.46 | -89.45 | -4.32% |
| S&P/TSX Canadian Gold Index | 130.30 | -14.37 | -9.93% |
| XAU | 49.71 | -7.64 | -13.32% |
| Gold Futures | 1,114.60 | -35.00 | -3.04% |
| Oil Futures | 42.15 | -9.26 | -18.01% |
| Natural Gas Futures | 2.81 | -0.11 | -3.70% |
| 10-Yr Treasury Bond | 2.20 | -0.15 | -6.54% |
| Index | Close | Quarterly Change($) |
Quarterly Change(%) |
|---|---|---|---|
| DJIA | 17,477.40 | -795.16 | -4.35% |
| S&P 500 | 2,091.54 | -31.19 | -1.47% |
| S&P Energy | 506.05 | -81.88 | -13.93% |
| S&P Basic Materials | 286.35 | -36.09 | -11.19% |
| Nasdaq | 5,048.24 | -0.06 | -0.00% |
| Russell 2000 | 1,212.69 | -31.26 | -2.51% |
| Hang Seng Composite Index | 3,284.75 | -638.75 | -16.28% |
| Korean KOSPI Index | 1,983.46 | -123.04 | -5.84% |
| S&P/TSX Canadian Gold Index | 130.30 | -40.18 | -23.57% |
| XAU | 49.71 | -25.41 | -33.83% |
| Gold Futures | 1,114.60 | -113.60 | -9.25% |
| Oil Futures | 42.15 | -17.54 | -29.39% |
| Natural Gas Futures | 2.81 | -0.21 | -6.83% |
| 10-Yr Treasury Bond | 2.20 | +0.06 | +2.61% |
Please consider carefully a fund’s investment objectives, risks, charges and expenses. For this and other important information, obtain a fund prospectus by visiting www.usfunds.com or by calling 1-800-US-FUNDS (1-800-873-8637). Read it carefully before investing. Distributed by U.S. Global Brokerage, Inc.
All opinions expressed and data provided are subject to change without notice. Some of these opinions may not be appropriate to every investor.
Stock markets can be volatile and share prices can fluctuate in response to sector-related and other risks as described in the fund prospectus.
Foreign and emerging market investing involves special risks such as currency fluctuation and less public disclosure, as well as economic and political risk. By investing in a specific geographic region, a regional fund’s returns and share price may be more volatile than those of a less concentrated portfolio.
The Emerging Europe Fund invests more than 25 percent of its investments in companies principally engaged in the oil & gas or banking industries. The risk of concentrating investments in this group of industries will make the fund more susceptible to risk in these industries than funds which do not concentrate their investments in an industry and may make the fund’s performance more volatile.
Because the Global Resources Fund concentrates its investments in a specific industry, the fund may be subject to greater risks and fluctuations than a portfolio representing a broader range of industries.
Gold, precious metals, and precious minerals funds may be susceptible to adverse economic, political or regulatory developments due to concentrating in a single theme. The prices of gold, precious metals, and precious minerals are subject to substantial price fluctuations over short periods of time and may be affected by unpredicted international monetary and political policies. We suggest investing no more than 5 percent to 10 percent of your portfolio in these sectors.
Bond funds are subject to interest-rate risk; their value declines as interest rates rise. Though the Near-Term Tax Free Fund seeks minimal fluctuations in share price, it is subject to the risk that the credit quality of a portfolio holding could decline, as well as risk related to changes in the economic conditions of a state, region or issuer. These risks could cause the fund’s share price to decline. Tax-exempt income is federal income tax free. A portion of this income may be subject to state and local taxes and at times the alternative minimum tax. The Near-Term Tax Free Fund may invest up to 20% of its assets in securities that pay taxable interest. Income or fund distributions attributable to capital gains are usually subject to both state and federal income taxes.
Investing in real estate securities involves risks including the potential loss of principal resulting from changes in property value, interest rates, taxes and changes in regulatory requirements.
Past performance does not guarantee future results.
Some link(s) above may be directed to a third-party website(s). U.S. Global Investors does not endorse all information supplied by this/these website(s) and is not responsible for its/their content.
These market comments were compiled using Bloomberg and Reuters financial news.
Fund portfolios are actively managed, and holdings may change daily. Holdings are reported as of the most recent quarter-end. Holdings as a percentage of net assets as of 6/30/2015:
Keurig Green Mountain, Inc.: 0.0%
Mead Johnson Nutrition Co.: 0.0%
*The above-mentioned indices are not total returns. These returns reflect simple appreciation only and do not reflect dividend reinvestment.
The Dow Jones Industrial Average is a price-weighted average of 30 blue chip stocks that are generally leaders in their industry.
The S&P 500 Stock Index is a widely recognized capitalization-weighted index of 500 common stock prices in U.S. companies.
The Nasdaq Composite Index is a capitalization-weighted index of all Nasdaq National Market and SmallCap stocks.
The Russell 2000 Index® is a U.S. equity index measuring the performance of the 2,000 smallest companies in the Russell 3000®, a widely recognized small-cap index.
The Hang Seng Composite Index is a market capitalization-weighted index that comprises the top 200 companies listed on Stock Exchange of Hong Kong, based on average market cap for the 12 months.
The Taiwan Stock Exchange Index is a capitalization-weighted index of all listed common shares traded on the Taiwan Stock Exchange.
The Korea Stock Price Index is a capitalization-weighted index of all common shares and preferred shares on the Korean Stock Exchanges.
The Philadelphia Stock Exchange Gold and Silver Index (XAU) is a capitalization-weighted index that includes the leading companies involved in the mining of gold and silver.
The U.S. Trade Weighted Dollar Index provides a general indication of the international value of the U.S. dollar.
The S&P/TSX Canadian Gold Capped Sector Index is a modified capitalization-weighted index, whose equity weights are capped 25 percent and index constituents are derived from a subset stock pool of S&P/TSX Composite Index stocks.
The S&P 500 Energy Index is a capitalization-weighted index that tracks the companies in the energy sector as a subset of the S&P 500.
The S&P 500 Materials Index is a capitalization-weighted index that tracks the companies in the material sector as a subset of the S&P 500.
The S&P 500 Financials Index is a capitalization-weighted index. The index was developed with a base level of 10 for the 1941-43 base period.
The S&P 500 Industrials Index is a Materials Index is a capitalization-weighted index that tracks the companies in the industrial sector as a subset of the S&P 500.
The S&P 500 Consumer Discretionary Index is a capitalization-weighted index that tracks the companies in the consumer discretionary sector as a subset of the S&P 500.
The S&P 500 Information Technology Index is a capitalization-weighted index that tracks the companies in the information technology sector as a subset of the S&P 500.
The S&P 500 Consumer Staples Index is a Materials Index is a capitalization-weighted index that tracks the companies in the consumer staples sector as a subset of the S&P 500.
The S&P 500 Utilities Index is a capitalization-weighted index that tracks the companies in the utilities sector as a subset of the S&P 500.
The S&P 500 Healthcare Index is a capitalization-weighted index that tracks the companies in the healthcare sector as a subset of the S&P 500.
The S&P 500 Telecom Index is a Materials Index is a capitalization-weighted index that tracks the companies in the telecom sector as a subset of the S&P 500.
The NYSE Arca Gold Miners Index is a modified market capitalization weighted index comprised of publicly traded companies involved primarily in the mining for gold and silver.
The Consumer Price Index (CPI) is one of the most widely recognized price measures for tracking the price of a market basket of goods and services purchased by individuals. The weights of components are based on consumer spending patterns.
The Purchasing Manager’s Index is an indicator of the economic health of the manufacturing sector. The PMI index is based on five major indicators: new orders, inventory levels, production, supplier deliveries and the employment environment.
The Chicago Board Options Exchange (CBOE) Volatility Index (VIX) shows the market's expectation of 30-day volatility.
The S&P 500 Oil Refining Index is a capitalization weighted index.
The Alerian MLP Index is the leading gauge of large- and mid-cap energy Master Limited Partnerships. The capitalization-weighted index includes 50 prominent companies.
The Bloomberg Dry Ships Index is a capitalization weighted index.
The S&P/TSX Capped Diversified Metals and Mining Index is an index of companies engaged in diversified production or extraction of metals and minerals.
The S&P/TSX Capped Energy Index is a constrained market capitalization-weighted index that consists of Canadian energy sector companies listed on the Toronto Stock Exchange.


