In an effort to remain as terse as possible I have selected five markets (6 charts) which I believe will be of most importance and interest during 2013:
Copper:
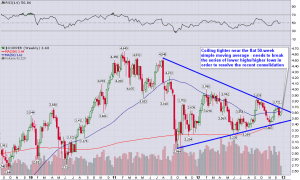
Since the large sell-off during September 2011, copper has continued to trade in a tightening coil within a large symmetrical triangle - the outlook appears to be bright for copper during the first half of 2013 as Chinese construction demand ramps up once again. However, in order to instill confidence in the long side of the market it will be necessary for copper to break the series of lower highs.
Gold:
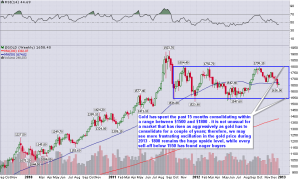
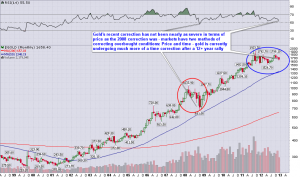
Gold has remained range-bound during 2012 with several attempts to breakout above $1800/ounce finding stiff resistance. However, gold bulls need only to look at a monthly chart to find some perspective:
While gold suffered some vicious sell-offs during 2012 (over $100 on February 29th, over $40 on November 2nd etc.), the monthly chart shows nothing more than a garden variety consolidation within the context of a powerful long-term uptrend.
Shanghai Composite:
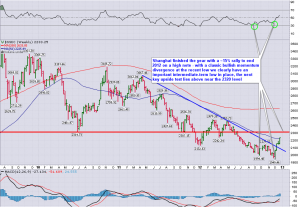
Chinese equities enter 2013 with a full head of steam.
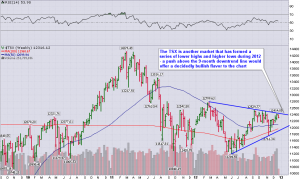
Toronto Stock Exchange Composite Index:
2012 was a frustrating year for Canadian equity investors, however, the TSX Composite is set-up nicely heading into 2013.
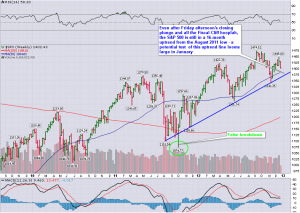
S&P 500:
Even after Friday's late session sell-off 2012 was a good year for US equity investors. The uptrend line drawn from the August 2011 capitulation low will come into full focus should equities come under additional pressure during early January.
Summary:
As we enter 2013 the S&P 500 is potentially facing a huge test of its uptrend from the August 2011 low. Meanwhile, copper and gold are positioned near important levels from which they could easily make outsized moves early in the new year. Investors should also be mindful of the January Barometer and the "first five days indicator", in addition to the January Effect which we have already begun to see over the past several trading sessions.




One thought on “The Most Important Charts for 2013”
Comments are closed.