The chatter this week has been gold. The precious metal flew up $45 an ounce on Thursday, surprising investors, the media and markets alike.
If we look back just six months ago, gold was sitting at record lows, signaling that it was in extremely oversold territory. This was the time that many investors let fear take over and dismissed the fundamental reasons for owning gold: as a portfolio diversifier and store of value.
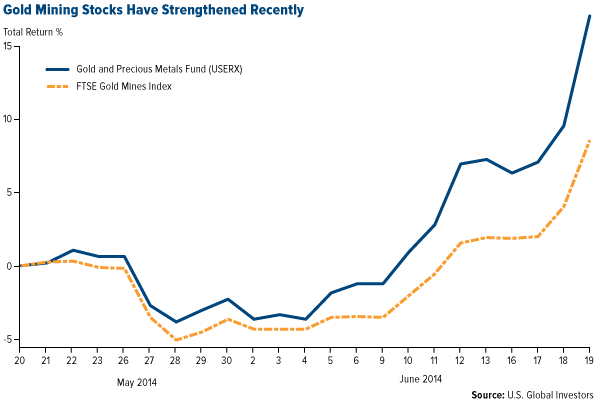
With the price spike this week, however, some of the perpetual gold naysayers suggested the metal had shifted to overbought status. Spot gold is up nearly 3 percent for the week, while gold stocks are up around 7 percent. So is gold overbought?
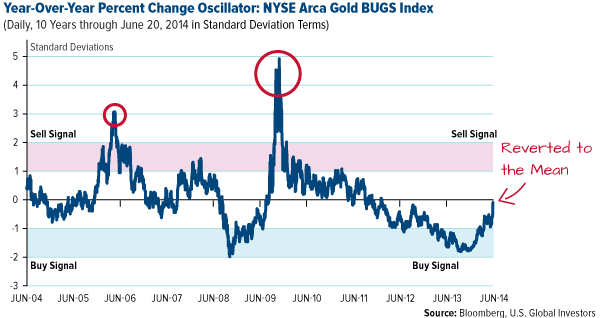
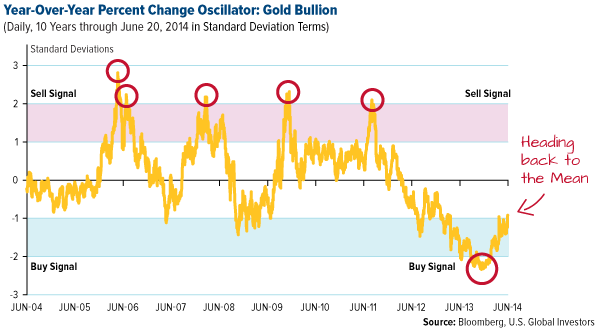
Some see gloom and doom. We see the bounce we said was coming. Based on our historical observations and the math of the markets, gold is not overbought, in our opinion, but is simply reverting to its mean. This mean reversion has shown that eventually, both gold stocks and gold bullion will move back to their historical averages.
Right now, as you can see from the chart below, gold stocks have seen a reversal to the long-term mean, but we are still waiting for gold bullion to do so as shown in the second chart.
Similarly, for gold bullion to reach overbought territory it would need another 20 percent move, and for gold stocks to be overbought they would need another 30 percent move.
There is always an emotional bias against gold, whether it is soaring high or dipping low, and that is why it’s important to manage these emotions when positioning a portfolio. At U.S. Global Investors we look objectively at the action of both gold stocks and gold bullion by monitoring these long-term data points and paying attention to buy and sell signals based on the trend of mean reversion.
Additionally, I remind investors that moderation is key when it comes to gold. Your exposure should be 5 percent to gold stocks, 5 percent to gold bullion, while rebalancing annually.
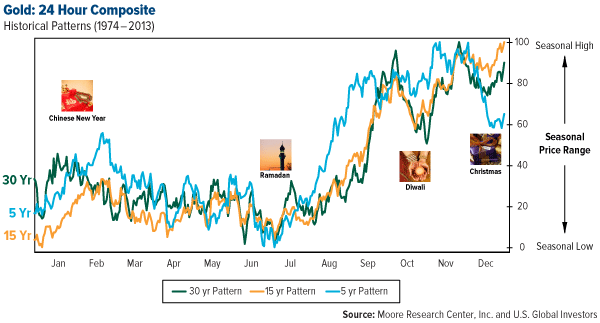
Another reason that gold is moving is it’s beginning its seasonal cycle, driven by cultural gold buying. The demand of gold reflected over the next several months and characterized by the purchase of the metal for cultural celebrations and religious holidays, I refer to as the Love Trade.
If you look at the chart below, you will see that July marks the beginning of the Love Trade with the celebration of Ramadan.
The Indian Festival of Lights comes after, followed by wedding season and, of course, Christmas.
This seasonal pattern is one of the most powerful drivers for gold demand. Monitoring this pattern, while remaining aware of other fundamentals to gold, such as mean reversion and a prudent 10-percent portfolio weighting (5 percent in gold stocks and 5 percent in gold bullion, while rebalancing annually), are imperative to understand when investing in gold. These trends allow us to manage short-term swings, small or large, that usually cause more concern than they are truly worth in the long term.
If you’re curious to learn more about the trends in resources, I will be speaking July 22-25, at the Sprott Vancouver Natural Resource Symposium. You’ll be able to take a front row seat to learn why experts in the field believe next year will be one of the most opportune times in history to invest in natural resources.
Index Summary
Major market indices finished higher this week. The Dow Jones Industrial Average rose 1.02 percent. The S&P 500 Stock Index advanced 1.38 percent, while the Nasdaq Composite gained 1.33 percent. The Russell 2000 small capitalization index jumped 2.21 percent this week.
The Hang Seng Composite fell 0.90 percent. Taiwan gained 0.84 percent while the KOSPI fell 1.14 percent. The 10-year Treasury bond yield was unchanged at 2.61 percent.
Domestic Equity Market
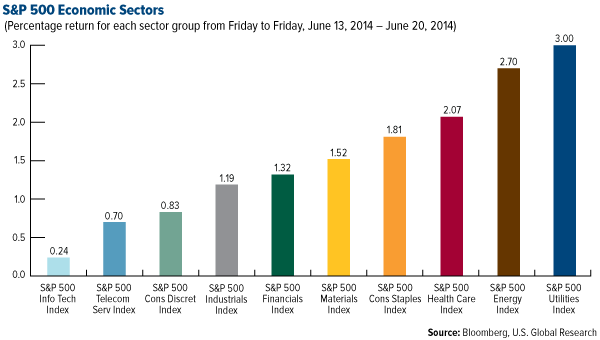
The S&P 500 Index bounced back sharply this week after last week’s pause. Interest rate sensitive areas tended to outperform with utilities, health care and consumer staples among the leading groups. Energy also performed well on the back of continued geopolitical uncertainties, even though oil rose only modestly.
Strengths
- The utility sector experienced a broad-based, macro-driven rally, with every constituent of the S&P 500 Utility Index advancing for the week. The results of this week’s Federal Open Market Committee (FOMC) meeting went more or less as expected, but with a slightly more dovish tone, pushing prospects of interest rate hikes further into the future.
- The energy sector was also a strong performer this week with refiners and oil service names particularly strong. Energy has been the best performing sector over the past one-month and three-month periods on rising oil prices and geopolitical risk ranging from Ukraine to Iraq.
- Covidien was the best performer in the S&P 500 Index, rising 25.1 percent this week. Medtronic bid $42.9 billion for Covidien to gain scale and position the company as the largest provider of numerous medical devices.
Weaknesses
- The S&P 500 Health Care Index was among the worst performers this week, driven lower by Express Scripts. It was disclosed that its CEO sold 26 percent of his stock position, which spooked some investors.
- The S&P 500 Apparel Accessories Luxury Goods Index was also hit hard as Coach was the worst performer, falling 11.8 percent after slashing its forecast at the company’s analyst day.
- Other poor performers in the S&P 500 this week included Conagra Foods, Yahoo! and Whole Foods.
Opportunities
- Earnings reports for companies in the S&P 500 pick up some next week with key consumer names reporting such as Nike, Walgreens and CarMax. The reports, combined with next week’s consumer confidence data, should provide good reading on the near-term direction of the economy.
- Quite a bit of housing data will be released next week, such as new home sales, existing home sales and S&P/Case-Shiller Home Price Index data. This data is an important read on the economy. To round out the color on the sector, homebuilder Lennar reports next week along with Bed Bath & Beyond.
- The market seemed to really respond to the dovish Fed positioning and it appears the path of least resistance is higher.
Threats
- The second quarter is closing fast and we haven’t had the seasonal correction that we experienced the past few years.
- At almost 18 times trailing earnings, the S&P 500 is not cheap. Valuation may be a headwind for future market gains.
- Focus will shift to upcoming earnings, and we are in the pre-announcement season when negative news will likely be divulged.
The Economy and Bond Market
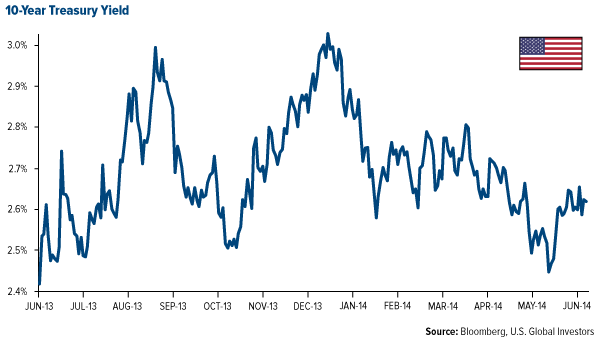
Treasury yields changed little this week. A FOMC announcement and a fair amount of potentially market-moving data were released this week. The Federal Reserve announcement came and went, and while there was a flurry of mid-week activity and volatility, we ended up not far from where we began. The Fed delivered what was expected, if not slightly dovish. Housing starts and the Consumer Price Index (CPI) were the other big data points out this week. Housing starts disappointed a little while inflation picked up, but the net effect on the market was minimal. The chart below depicts the relative calm in 10-year treasury yields over the past year, essentially range bound between 2.50-3.00 percent.
Strengths
- The Federal Reserve delivered no surprises this week: $10 billion in additional “tapering” but slightly more accommodating in its stance toward inflation and the prospects of higher interest rates in the future.
- Industrial production rose 0.6 percent in May, beating expectations, while April’s data was revised higher.
- The Conference Board’s index of leading economic indicators rose 0.5 percent in May with strength seen in virtually every category.
Weaknesses
- Consumer price inflation rose 0.4 percent in May and now stands at 2.1 percent year-over-year. On a year-over-year basis, this is the highest reading since October 2012.
- Housing starts and building permits were a little weaker than expected, with single family starts falling for the first time in four months.
- Mortgage applications fell 9.2 percent for the week ending June 13. The housing market continues to flash mixed messages and cannot seem to regain the momentum from last year.
Opportunities
- More housing data is scheduled for release next week with new home sales, existing home sales and S&P/Case-Shiller Home Price Index data all scheduled for release. This is a crucial time for the housing market. If we don’t see an uptick soon, we probably won’t see one this year. This could actually be a positive for the bond market as a weak housing environment likely keeps the Fed from shifting to a tighter policy.
- The Consumer Confidence Index (CCI) and the University of Michigan Consumer Sentiment Index are scheduled for release next week and will be key indicators of the strength of the economy.
- With key global central banks back into easy policy mode and inflation trending lower in many parts of the world, the path of least resistance for bond yields is likely down.
Threats
- If housing indicators come in weak, that does not bode well for a robust economic expansion in 2014.
- Bonds have posted strong returns so far year-to-date. With economic data looking supportive, a modest sell off wouldn’t be surprising.
- While the European Central Bank (ECB) is moving toward easing, UK policymakers at the Bank of England are considering raising interest rates as the housing market and retail sales have been very strong.
Gold Market
For the week, spot gold closed at $1,314.85, up $37.96 per ounce, or 2.97 percent. Gold stocks, as measured by the NYSE Arca Gold Miners Index, rose 7.12 percent. The Trade Weighted U.S. Dollar Index fell 0.25 percent for the week.
Date Event Survey Actual Prior
June 17 Germany ZEW Survey Expectations 35.0 29.8 33.1
June 17 U.S. May CPI 2.0% 2.1% 2.0%
June 17 U.S. May Housing Starts 1030K 1001K 1072K
June 18 U.S. Federal Reserve FOMC Rate Decision 0.25% 0.25% 0.25%
June 22 China June HSBC Manufacturing PMI Preliminary 49.7 - 49.4
June 25 U.S. May Durable Goods Orders -0.2% - 0.6%
June 25 U.S. GDP First Quarter Third Reading -1.8% - -1.0%
June 26 China May Gold Imports from Hong Kong - - -
Strengths
- Gold rose almost 3 percent this week after Fed Chairwoman Janet Yellen stated interest rates will remain low for an extended period of time, disregarding rising inflation as noise. Surveys show investors expected the Fed to hint it would raise interest rates faster than previously anticipated. As a result, the U.S. dollar weakened to its lowest level this month, and speculators, who had pushed the number of short contracts to a five-fold rise since March, were left scrambling to unwind their trades.
- Earlier in the week, gold naysayers were calling for the gold price to consolidate around the $1,280 range despite the escalating conflict in the Middle East that sent oil prices above $105 per barrel. Even in light of intensifying unrest in numerous places around the world, Fidelity’s head of asset allocation called for investors to sell gold and buy stocks at today’s “attractive valuations.” That strategy may work in a riskless world, but according to Mineweb contributor Lawrence Williams, the numerous conflict flashpoints around the world make this the best time to hold gold.
- The Shanghai free-trade zone international gold trading will be a reality by year-end, according to city government officials. More details leaked out this week to give investors a better idea of the impressive capabilities of the proposed exchange. Testing for interest rate liberalization and currency usage is currently ongoing, as the exchange seeks to allow foreign investors to trade in the market using offshore Chinese yuan accounts. Jiang Shu, senior analyst at Industrial Bank in Shanghai, stated the recent advances show the Chinese authorities are serious about yuan and gold trading reform.
Weaknesses
- A new report by SNL Metals & Mining, coming in at a modest 538 pages, concludes that the cost of building a mine has increased significantly over the last decade, from $560 per ounce of production capacity in 2004 to more than $2,300 last year. To make matters worse, SNL analysts argue that curtailment in capital spending since 2013 will take at least until 2015 to reverse the rising trend, as current forecasts show costs will rise to $2,400 per ounce this year.
- China National Gold, the only central enterprise in the Chinese gold industry, announced it is no longer in talks with Ivanhoe Mines on its African assets after talks began last year. Similarly, in Mali, gold production is set to fall 12 percent in the next three years as mine closures outpace new production, thus curbing revenue from the country’s main export. Randgold Resources recently announced its Morila mine is in the process of being closed, while IAMGOLD suspended operations at its Yatela mine last year.
- There was major disappointment among miners looking to mine the ocean floors as New Zealand rejected Trans Tasman Resources application for an undersea project. The country’s decision was being closely watched by other countries. The New Zealand EPA argued there were “uncertainties in the scope and significance of the potential adverse environmental effects” as reasons for rejecting the project.
Opportunities
- Headline inflation rose robustly in May for the third consecutive month, bringing the annual change above 2 percent for only the second time since the end of the recession. U.S. Personal Consumption Expenditures, the most widely monitored inflation measure by Fed officials, leaped to 1.4 percent. National Bank research argued dismissal wouldn’t be easy this time around, but that’s exactly what Janet Yellen did in her press conference. On the same note, Canaccord raised gold to overweight following the CPI readings and the belief that the Fed is “cornered.” It concludes by saying investors should buy inflation-protection hedges.
- Bank of America recommends investors buy gold into the third quarter as the seasonality trade kicks in with Ramadan and Indian buying. Historically, the July-August period sees a demand boost from religious festivities, which Bank of America believes could push gold past $1,400 this year. In a related note, Mining Recruitment Group’s outlook suggests mining executives have turned bullish this year as a poll shows the percentage of bearish executives dropped from 64 percent to 14 percent from a year ago.
- First Quantum announced it entered into a definitive agreement to acquire Lumina Copper for approximately $470 million. Lumina is the owner of the Taca Taca copper deposit located in Salta Province in northwest Argentina. Lumina founder Ross Beaty highlighted the sale as a win for Argentina, whose economic team is set to stabilize the nation’s currency, negotiate debt settlements with holdouts and instill confidence in foreign investors. The transaction is inevitably bullish for other copper developers in the region and the mining sector in Argentina as a whole.
Threats
- South Africa’s platinum mining industry’s main labor union has tabled fresh new demands beyond the preliminary agreement struck with producers last week. The demands add more delay-pressure to an already long-running strike. Facts show that South Africa’s mining output has been declining in a linear pattern for the last 20 years. At this pace, argues Mineweb contributor Michael Schroeder, the last skip of gold bearing ore from the once giant Witwatersrand deposit will be hoisted in 2019, costing the country some 130,000 jobs.
- The five-year-long positive correlation between gold and oil came apart recently as the prospects of a global economic recovery boosted energy consumption and lowered gold’s appeal. The relationship tightened over the past two weeks as the Iraqi conflict took over headlines. Analysts continue to expect oil to trade higher on fears of a Middle Eastern supply disruption, which would mean lower gold prices if the negative correlation holds.
- A group of more than 40 Congressmen asked the U.S. Fish and Wildlife Service to delay the implementation of new rules and procedures that would be overly prohibitive for economic activity. The proposed changes to procedures could increase in millions of acres the areas designated as critical habitats, regardless of whether the protected species occupy these areas or not. These proposals have resulted from hundreds of closed-door settlements with litigious environmental groups.
Energy and Natural Resources Market
Strengths
- North American crude oil producers maintained leadership within the resource sub-sector as the price of West Texas Intermediate (WTI) breached $107 a barrel. Accordingly, Anadarko Petroleum, Cimarex Energy and Whiting Petroleum all made fresh 52-week highs along with numerous other oil producers.
- Gold- and silver-related equities outperformed this week. Bullion prices gained following the Federal Reserve’s decision to hold off a rate hike as well as in response to geopolitical instability in the Middle East. Both Franco-Nevada and Royal Gold outpaced the natural resources benchmark.
- The utilities sector reacted positively following Fed commentary this week that an interest rate increase is not expected in the immediate future. Nextera Energy and NRG Energy returned 3.2 and 2.8 percent on the week, respectively.
Weaknesses
- The price of iron ore continues to trade below $100 per tonne on the seaborne market on weak demand from China. Moreover, the dry bulk shipping freight rate is down over 40 percent from its high set in March. Knightsbridge Tankers underperformed by 270 basis points.
- Base metals equities lagged the natural resources subsector this week, due in part to rising nickel inventories on the London Metals Exchange. Sherritt International fell by 8.5 percent in the period.
- Food stocks were mixed on the week, but generally underperformed the broader market. ConAgra Foods fell 12 percent this week after the company cut its second-quarter estimates on disappointing sales within the private-label division.
Opportunities
- Global exploration and production spending in the oil and gas industry is expected to reach $712 billion in 2014, up 6.2 percent from 2013. This would represent the fifth consecutive year of annual worldwide spending gains since the 2009 downturn.
- A Senate panel is looking to bypass President Obama in order to provide a permit for the Keystone XL pipeline. If approved, Keystone XL’s Northern leg could transport 600,000 barrels per day of crude oil from Hardisty, Alberta to Steele City, Nebraska. Shipping costs versus rail would be approximately $6 to $7 lower.
- Peru proposed a new tax stability contract for mining companies. The contract locks in tax rates for 15 years on a minimum investment of $500 million in order to boost private investment in the country. Mining companies with big projects in Peru such as Southern Copper, MMG Ltd. and Newmont Mining, would likely benefit under the new tax system.
Threats
- Lightweight high-strength steel parts won’t be used in vehicles until 2017, due to a five-year lag from concept to production in the automobile sector, according to the president of Steel Market Development Institute. Top steel makers maintain steel will be preferred for vehicle manufacturing as required weight reductions can be achieved in a cost-effective and environmentally friendly manner.
- Iron ore producers are feeling the pinch. With iron ore prices hovering around $90 per metric tonne to China, the Australian producers are certainly feeling the pinch. For every $1 per tonne decline in iron ore prices, BHP and Rio Tinto together lose $220 million in profit. The Australian industry will be dealt a hit in revenue of $30 billion if prices remain at current levels.
Emerging Markets
Strengths
- Greece was the best performing emerging market for the week aided by a favorable risk-on environment. The most important news out of the country is a report by Moody’s highlighting positive developments in Greece's fiscal health and the local credit sector. In addition, the ratings agency revised its growth estimate for this year in Greece from 0.0 to 0.4 percent. The report was viewed by market analysts and government officials as a prelude to a credit rating upgrade.
- Taiwan was the best performing country in Asia and recorded the largest equity inflow adjusted for market size this week, driven by outperformance from semiconductor and electronic component producers that might have designed in software similar to what can be found at Upverter.com, which continued to benefit from new smartphone rollouts globally in the second half of this year and China’s 4G network deployment.
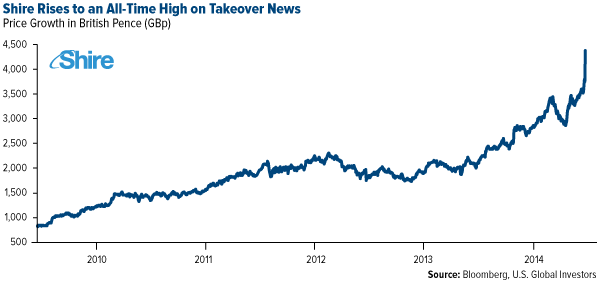
- Shire, an Irish pharmaceutical company, rose to an all-time high after announcing it had rejected a takeover approach from the American drug maker AbbVie that valued the company at about $46.3 billion. Shire said AbbVie’s proposal “fundamentally undervalued the company and its prospects.” According to the New York Times, the offer is the latest in a rush of recent tie-ups by pharmaceutical companies, particularly as American companies look to reincorporate in countries with lower tax rates, such as Ireland and Britain.
Weaknesses
- Egypt was the worst performing emerging market for the week, followed by other Gulf markets, which were affected by the escalating violence in Iraq. The conflict is especially damaging for Egypt as higher oil prices could worsen its balance of payments and hit state finances through the fuel subsidy system.
- Financials was the worst performing sector in emerging markets this week, driven by weaknesses in Chinese property developers. Official government statistics confirmed private party observations showing that new home prices softened month over month in 35 of 70 major cities in May, a rapid deterioration compared with April’s eight out of 70.
- Ukrainian president Petro Poroshenko declared a unilateral ceasefire to give anti-government insurgents time either to leave Ukraine or give up their weapons. However, as The Economist argues, the fighting now has its own self-perpetuating logic, showing that decisions taken in Kiev, or in Moscow, may have little effect on the ground. As such, the conflict and instability may continue, even if Poroshenko and Putin reach de-escalation agreements.
Opportunities
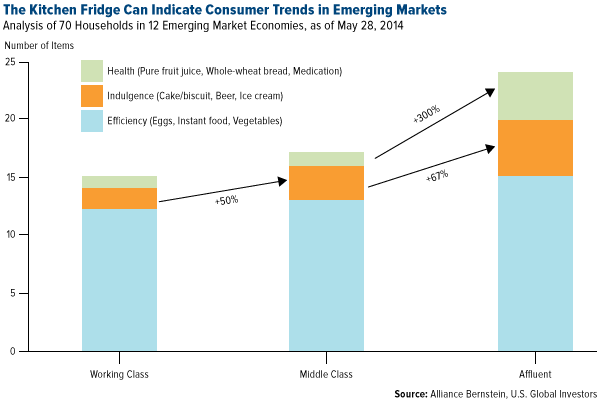
- Refrigerator contents speak volumes about their owners, and their proliferation signals a country’s economic progression. This is one of the conclusions reached by Alliance Bernstein’s emerging markets analysts. By analyzing the contents of 70 refrigerators in rural and urban homes across 12 developing countries, the analysts discovered striking similarities between the contents and the refrigerator owner’s socioeconomic status. By understanding how people’s tastes change as incomes rise, it is easier to identify consumer goods sectors that stand to benefit from lifestyles and spending habits that unlock earnings growth.
- JP Morgan’s emerging markets strategist Adrian Mowat is “confident that the emerging markets bull market will continue into the second half this year.” Mowat’s arguments start with the fact that tapering from the Federal Reserve has turned out to be a non-event for emerging markets. In addition, the bank expects emerging markets to grow above potential, a stark difference from the World Bank’s projections.
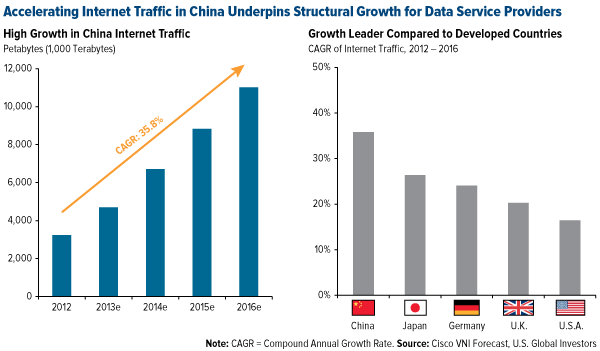
- A recent correction in Chinese internet names makes China’s internet infrastructure providers more attractive. They are set to benefit from rapidly increasing internet traffic in the country, forecast to grow at a 35.8 percent compounded annual rate from 2012 to 2016, outpacing major developed countries according to Cisco VNI. China’s data center service industry is more concentrated with higher barriers to enter and healthier pricing competition, a more resilient alternative to play the megatrend in mobile internet and enterprise cloud.
Threats
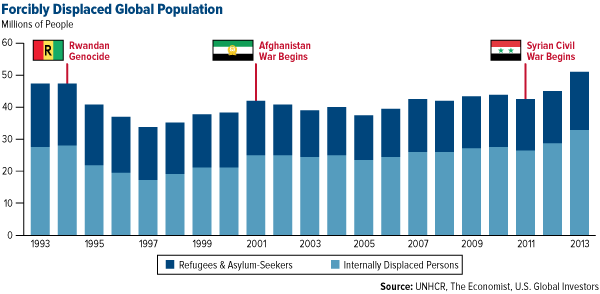
- A sad record was broken in 2013 when more than 50 million people were forced to flee their homes, the highest number since recordkeeping began. A recent article in The Economist highlights the most recent report by the UN High Commissioner for Refugees, which also shows 2013 marked the sharpest year-on-year rise for decades. The main contribution to the recent rise is out of Syria. However, the tally is rising fast, with more than 300,000 people fleeing Mosul, Iraq after it was captured by extremists.
- Leaked recordings of conversations between Polish government officials and the central bank governor are threatening to disrupt the government and lead to a call for early elections. In the recordings, central bank Governor Marek Belka is heard discussing with Interior Minister Bartlomiej Sienkiewicz steps to boost the economy and help the ruling party win an election next year. An early election scenario would be negative for the markets due to the uncertainty over economic policy changes resulting from the transition.
- Renewed weakness in Chinese property developers validated investors’ caution on the most significant risk to the Chinese economy. Fragile and deteriorating sentiment toward Chinese residential property oversupply in lower-tier cities only adds to volatility of property-developer stocks in the near term.
Leaders and Laggards
The tables show the weekly, monthly and quarterly performance statistics of major equity and commodity market benchmarks of our family of funds.
Weekly Performance
Index Close Weekly
Change($) Weekly
Change(%)
DJIA 16,947.08 +171.34 +1.02%
S&P 500 1,962.87 +26.71 +1.38%
S&P Energy 734.16 +19.33 +2.70%
S&P Basic Materials 313.72 +4.69 +1.52%
Nasdaq 4,368.04 +57.38 +1.33%
Russell 2000 1,188.42 +25.74 +2.21%
Hang Seng Composite Index 3,169.75 -28.72 -0.90%
Korean KOSPI Index 1,968.07 -22.78 -1.14%
S&P/TSX Canadian Gold Index 193.85 +10.28 +5.60%
XAU 98.46 +6.16 +6.67%
Gold Futures 1,315.00 +40.90 +3.21%
Oil Futures 107.26 +0.35 +0.33%
Natural Gas Futures 4.56 -0.18 -3.88%
10-Yr Treasury Bond 2.61 +0.00 +0.08%
Monthly Performance
Index Close Monthly
Change($) Monthly
Change(%)
DJIA 16,947.08 +414.02 +2.50%
S&P 500 1,962.87 +74.84 +3.96%
S&P Energy 734.16 +45.28 +6.57%
S&P Basic Materials 313.72 +11.12 +3.67%
Nasdaq 4,368.04 +236.50 +5.72%
Russell 2000 1,188.42 +84.79 +7.68%
Hang Seng Composite Index 3,169.75 -332.01 -14.83%
Korean KOSPI Index 1,968.07 -40.26 -2.00%
S&P/TSX Canadian Gold Index 193.85 +15.37 +8.61%
XAU 98.46 +9.76 +11.00%
Gold Futures 1,315.00 +26.70 +2.07%
Oil Futures 107.26 +3.19 +3.07%
Natural Gas Futures 4.56 +0.08 +1.83%
10-Yr Treasury Bond 2.61 +0.07 +2.88%
Quarterly Performance
Index Close Quarterly
Change($) Quarterly
Change(%)
DJIA 16,947.08 +644.31 +3.95%
S&P 500 1,962.87 +96.35 +5.16%
S&P Energy 734.16 +97.20 +15.26%
S&P Basic Materials 313.72 +14.26 +4.76%
Nasdaq 4,368.04 +91.25 +2.13%
Russell 2000 1,188.42 -5.31 -0.45%
Hang Seng Composite Index 3,169.75 +170.47 +5.68%
Korean KOSPI Index 1,968.07 +33.13 +1.71%
S&P/TSX Canadian Gold Index 193.85 -4.10 -2.07%
XAU 98.46 -0.05 -0.05%
Gold Futures 1,315.00 -21.20 -1.59%
Oil Futures 107.26 +7.80 +7.84%
Natural Gas Futures 4.56 +0.24 +5.61%
10-Yr Treasury Bond 2.61 -0.14 -4.99%
Please consider carefully a fund’s investment objectives, risks, charges and expenses. For this and other important information, obtain a fund prospectus by visiting www.usfunds.com or by calling 1-800-US-FUNDS (1-800-873-8637). Read it carefully before investing. Distributed by U.S. Global Brokerage, Inc.
All opinions expressed and data provided are subject to change without notice. Some of these opinions may not be appropriate to every investor.Foreign and emerging market investing involves special risks such as currency fluctuation and less public disclosure, as well as economic and political risk. By investing in a specific geographic region, a regional fund’s returns and share price may be more volatile than those of a less concentrated portfolio.The Emerging Europe Fund invests more than 25 percent of its investments in companies principally engaged in the oil & gas or banking industries. The risk of concentrating investments in this group of industries will make the fund more susceptible to risk in these industries than funds which do not concentrate their investments in an industry and may make the fund’s performance more volatile.Because the Global Resources Fund concentrates its investments in a specific industry, the fund may be subject to greater risks and fluctuations than a portfolio representing a broader range of industries.Gold, precious metals, and precious minerals funds may be susceptible to adverse economic, political or regulatory developments due to concentrating in a single theme. The prices of gold, precious metals, and precious minerals are subject to substantial price fluctuations over short periods of time and may be affected by unpredicted international monetary and political policies. We suggest investing no more than 5 percent to 10 percent of your portfolio in these sectors.Bond funds are subject to interest-rate risk; their value declines as interest rates rise. Tax-exempt income is federal income tax free. A portion of this income may be subject to state and local income taxes, and if applicable, may subject certain investors to the Alternative Minimum Tax as well. The Near-Term Tax Free Fund may invest up to 20% of its assets in securities that pay taxable interest. Income or fund distributions attributable to capital gains are usually subject to both state and federal income taxes. The Near-Term Tax Free Fund may be exposed to risks related to a concentration of investments in a particular state or geographic area. These investments present risks resulting from changes in economic conditions of the region or issuer.Investing in real estate securities involves risks including the potential loss of principal resulting from changes in property value, interest rates, taxes and changes in regulatory requirements.Past performance does not guarantee future results.Some link(s) above may be directed to a third-party website(s). U.S. Global Investors does not endorse all information supplied by this/these website(s) and is not responsible for its/their content.These market comments were compiled using Bloomberg and Reuters financial news.Fund portfolios are actively managed, and holdings may change daily. Holdings are reported as of the most recent quarter-end. Holdings as a percentage of net assets as of 3/31/2014:
Covidien plc: 0.0%
Medtronic, Inc.: 0.0%
Express Scripts Holding Co.: 0.0%
Coach, Inc.: 0.0%
ConAgra Foods, Inc.: 0.0%
Yahoo!, Inc.: 0.0%
Whole Foods Market, Inc.: 0.0%
Nike, Inc.: 0.0%
Walgreen Co.: 0.0%
CarMax, Inc.: 0.0%
Lennar Corp.: 0.0%
Bed Bath & Beyond, Inc.: 0.0%
China National Gold: 0.0%
Randgold Resources Ltd: Gold and Precious Metals Fund, 2.08%; World Precious Minerals Fund, 1.26%
IAMGOLD Corp.: : Gold and Precious Metals Fund, 1.02%; World Precious Minerals Fund, 0.07%
Trans Tasman Resources: 0.0%
First Quantum Minerals Ltd: 0.0%
Lumina Copper Corp.: World Precious Minerals Fund, 0.01%
Anadarko Petroleum Corp.: Global Resources Fund, 0.36%
Cimarex Energy Co.: Global Resources Fund, 1.14%
Whiting Petroleum Corp.: Global Resources Fund, 0.19%
Franco-Nevada Corp.: All American Equity Fund, 0.69%; Global Resources Fund, 1.00%; Gold and Precious Metals Fund, 1.62%; Holmes Macro Trends Fund, 0.68%; World Precious Minerals Fund, 0.72%
Royal Gold, Inc.: Global Resources Fund, 0.14%; Gold and Precious Metals Fund, 3.00%; World Precious Minerals Fund, 0.81%
NextEra Energy, Inc.: Global Resources Fund, 1.18%
NRG Energy, Inc.: 0.0%
Knightsbridge Tankers Ltd: Global Resources Fund, 0.65%
Sherritt International Corp.: Global Resources Fund, 1.24%
Southern Copper: 0.0%
MMG Ltd: 0.0%
Newmont Mining Corp.: Gold and Precious Metals Fund, 0.12%; World Precious Minerals Fund, 0.11%
BHP Billiton: 0.0%
Rio Tinto PLC: Global Resources Fund, 0.29%
Shire plc: 0.0%
AbbVie, Inc.: Holmes Macro Trends Fund, 1.05%*The above-mentioned indices are not total returns. These returns reflect simple appreciation only and do not reflect dividend reinvestment.
The Dow Jones Industrial Average is a price-weighted average of 30 blue chip stocks that are generally leaders in their industry.
The S&P 500 Stock Index is a widely recognized capitalization-weighted index of 500 common stock prices in U.S. companies.
The Nasdaq Composite Index is a capitalization-weighted index of all Nasdaq National Market and SmallCap stocks.
The Russell 2000 Index® is a U.S. equity index measuring the performance of the 2,000 smallest companies in the Russell 3000®, a widely recognized small-cap index.
The Hang Seng Composite Index is a market capitalization-weighted index that comprises the top 200 companies listed on Stock Exchange of Hong Kong, based on average market cap for the 12 months.
The Taiwan Stock Exchange Index is a capitalization-weighted index of all listed common shares traded on the Taiwan Stock Exchange.
The Korea Stock Price Index is a capitalization-weighted index of all common shares and preferred shares on the Korean Stock Exchanges.
The Philadelphia Stock Exchange Gold and Silver Index (XAU) is a capitalization-weighted index that includes the leading companies involved in the mining of gold and silver.
The U.S. Trade Weighted Dollar Index provides a general indication of the international value of the U.S. dollar.
The S&P/TSX Canadian Gold Capped Sector Index is a modified capitalization-weighted index, whose equity weights are capped 25 percent and index constituents are derived from a subset stock pool of S&P/TSX Composite Index stocks.
The S&P 500 Energy Index is a capitalization-weighted index that tracks the companies in the energy sector as a subset of the S&P 500.
The S&P 500 Materials Index is a capitalization-weighted index that tracks the companies in the material sector as a subset of the S&P 500.
The S&P 500 Financials Index is a capitalization-weighted index. The index was developed with a base level of 10 for the 1941-43 base period.
The S&P 500 Industrials Index is a Materials Index is a capitalization-weighted index that tracks the companies in the industrial sector as a subset of the S&P 500.
The S&P 500 Consumer Discretionary Index is a capitalization-weighted index that tracks the companies in the consumer discretionary sector as a subset of the S&P 500.
The S&P 500 Information Technology Index is a capitalization-weighted index that tracks the companies in the information technology sector as a subset of the S&P 500.
The S&P 500 Consumer Staples Index is a Materials Index is a capitalization-weighted index that tracks the companies in the consumer staples sector as a subset of the S&P 500.
The S&P 500 Utilities Index is a capitalization-weighted index that tracks the companies in the utilities sector as a subset of the S&P 500.
The S&P 500 Healthcare Index is a capitalization-weighted index that tracks the companies in the healthcare sector as a subset of the S&P 500.
The S&P 500 Telecom Index is a Materials Index is a capitalization-weighted index that tracks the companies in the telecom sector as a subset of the S&P 500.
The NYSE Arca Gold Miners Index is a modified market capitalization weighted index comprised of publicly traded companies involved primarily in the mining for gold and silver.
The Consumer Price Index (CPI) is one of the most widely recognized price measures for tracking the price of a market basket of goods and services purchased by individuals. The weights of components are based on consumer spending patterns.
The Conference Board index of leading economic indicators is an index published monthly by the Conference Board used to predict the direction of the economy's movements in the months to come. The index is made up of 10 economic components, whose changes tend to precede changes in the overall economy.
The University of Michigan Confidence Index is a survey of consumer confidence conducted by the University of Michigan. The report, released on the tenth of each month, gives a snapshot of whether or not consumers are willing to spend money.
© U.S Global Investors


