- JC Parets is the founder of Eagle Bay Capital, and editor of the AllStarCharts.com blog. Follow him on Twitter: @AllStarCharts
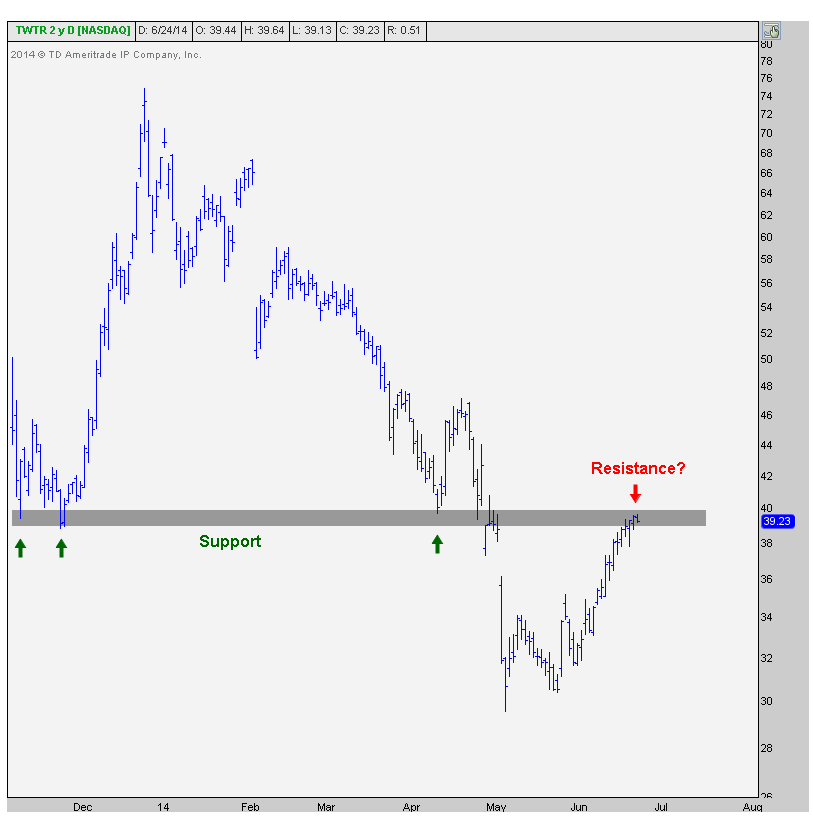
This is a stock that definitely used to get a lot of hype but lately the noise surrounding it has quieted down. We like that. After a 30% rally from last month’s lows, prices are now approaching that key $40 level that had previously served as support twice last November and again in April. On the first day of technical analysis kindergarten we’re taught that former support should turn into resistance. But through experience, I have since learned that if prices break through that potential resistance without much hesitation, an epic rally can develop quickly.
Here is a daily chart of $TWTR since the November IPO. It’s easy to see the former support and what could/should theoretically become overhead supply. My question is, What if it doesn’t?
What if we blow right through this level? What if the overhead supply right here doesn’t cause much trouble? What if we get a gap higher above this level? What if we pull back a bit and then break through? (most likely outcome in my opinion) <– All of these would be really bullish developments.
The scenario doesn’t get much cleaner than this. We have our levels. We want to be long only above that former support, and below that level we don’t want anything to do with it.
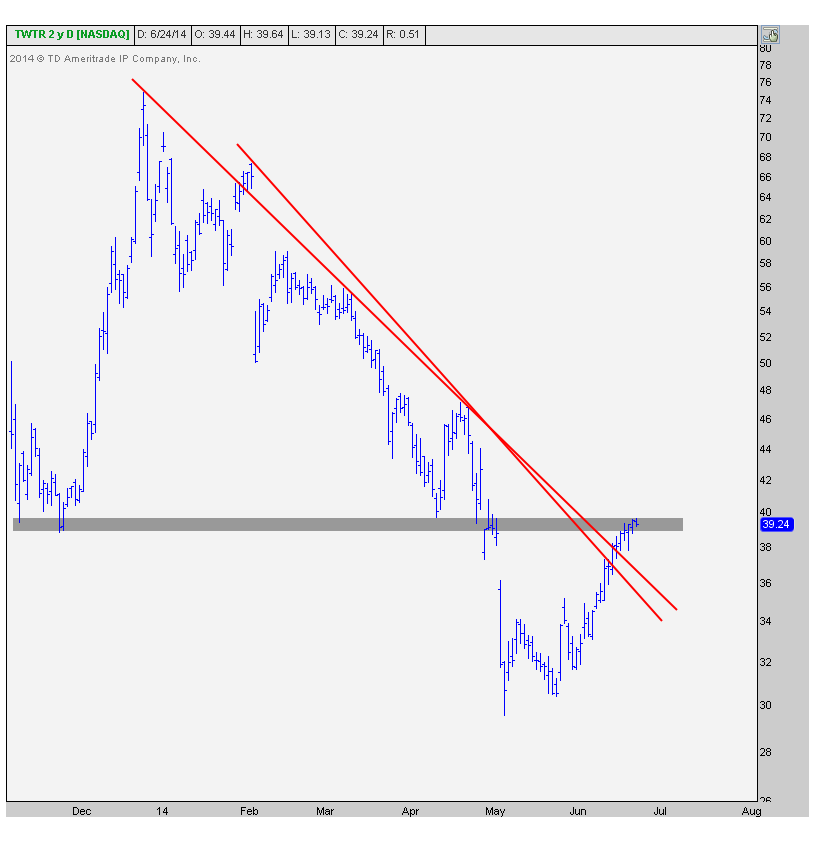
Here is another look at this chart but with two trendlines from the top. The good news here is that we are clearing what looks to me like two important trendlines. The bad news is that we’re still not through this overhead supply. But the levels are clear:
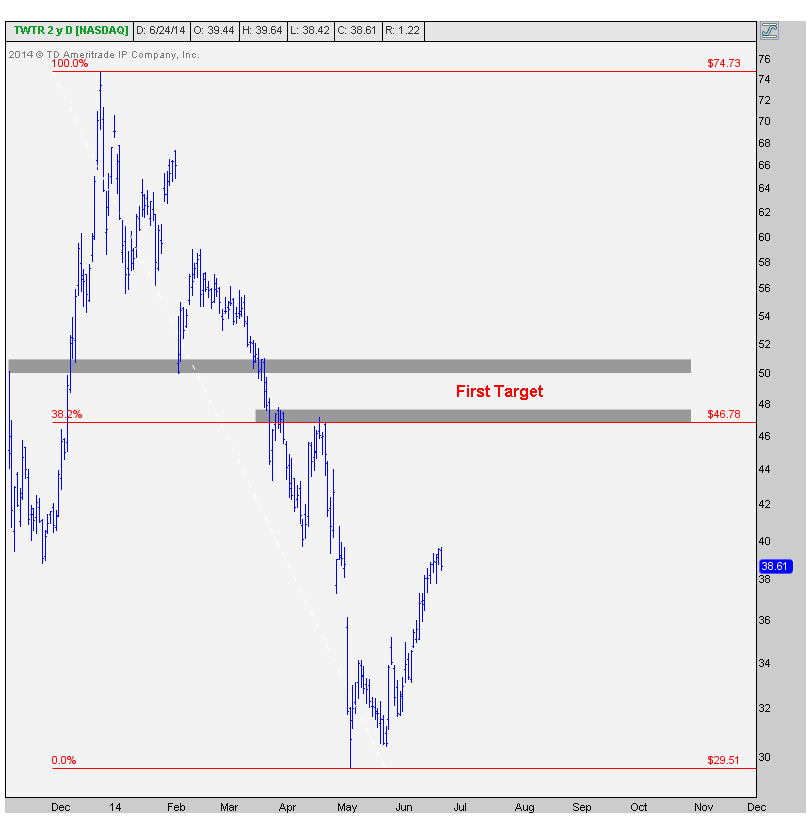
Price target-wise, if we can get going, the first target is between $47 and $51 which represents the 38.2% Fibonacci retracement from the entire 60% decline since the end of December. This area is also where prices ran into resistance after the IPO and again in April. Look how it also served as brief support in February. So this seems like a logical level to take some initial profits and reevaluate the entire situation. At that point, we want to ask ourselves: How did we get there? How was momentum? How was relative strength? etc. And then we can decide whether to call it, let it consolidate first, or stick with the entire position.
This chart gives us a quick 17%-27% target upon confirmation. I like it when my charts are clean like this and the risk is well defined. If and when we get through this overhead supply, we’ll be all over it. Until then, it’s just a waiting game….
***
REGISTER HERE for more information on how to access updated charts on these popular ticker symbols with annotations and commentary on a weekly basis.


