Disclaimer:
Readers are advised that the material contained herein is solely for information purposes. Readers are encouraged to conduct their own research and due diligence, and/or obtain professional advice. Nothing contained herein constitutes a representation by the publisher, nor a solicitation for the purchase or sale of securities. The information contained herein is based on sources which the publisher believes to be reliable, but is not guaranteed to be accurate, and does not purport to be a complete statement or summary of the available data. Any opinions expressed are subject to change without notice. The owner, editor, writer and publisher and their associates are not responsible for errors or omissions. They may from time to time have a position in the securities of the companies mentioned herein, and may change their positions without notice. (Any significant positions will be disclosed explicitly. This article is not intended to meet your specific individual investment needs and it is not tailored to your personal financial situation. Nothing contained herein constitutes, is intended, or deemed to be — either implied or otherwise — investment advice. Thomas Humphreys, Pacific Website Company Inc., and other entities in which he has an interest, employees, officers, family, and associates may from time to time have positions in the securities or commodities covered in these publications or web site. We reserve the right to buy and sell such securities or commodities without notice to readers. While the information herein is believed to be accurate and reliable it is not guaranteed or implied to be so. The information herein may not be complete or correct; it is provided in good faith but without any legal responsibility or obligation to provide future updates. Neither Thomas Humphreys, nor anyone else, accepts any responsibility, or assumes any liability, whatsoever, for any direct, indirect or consequential loss arising from the use of the information in these publications or web site.
Forward-Looking Statements: This article may include certain "forward-looking information" within the meaning of Canadian securities legislation. Forward-looking statements include predictions, projections and forecasts and are often, but not always, identified by the use of words such as "seek", "anticipate", "believe", "plan", "estimate", "forecast", "expect", "potential", "project", "target", "schedule", budget" and "intend" and statements that an event or result "may", "will", "should", "could" or "might" occur or be achieved and other similar expressions and includes the negatives thereof. All statements other than statements of historical fact included in this release, including, without limitation, statements regarding the potential of the Company's properties are forward-looking statements that involve various risks and uncertainties. There can be no assurance that such statements will prove to be accurate and actual results and future events could differ materially from those anticipated in such statements. Forward-looking statements are based on a number of material factors and assumptions. Important factors that could cause actual results to differ materially from Company's expectations include actual exploration results, changes in project parameters as plans continue to be refined, future metal prices, availability of capital and financing on acceptable terms, general economic, market or business conditions, uninsured risks, regulatory changes, delays or inability to receive required approvals, and other exploration or other risks detailed herein and from time to time in the filings made by the Company with securities regulators. Although the Company has attempted to identify important factors that could cause actual actions, events or results to differ from those described in forward-looking statements, there may be other factors that cause such actions, events or results to differ materially from those anticipated. There can be no assurance that forward-looking statements will prove to be accurate and accordingly readers are cautioned not to place undue reliance on forward-looking statements which speak only as of the date of this article. The Company disclaims any intention or obligation, except to the extent required by law, to update or revise any forward-looking statements, whether as a result of new information, future events or otherwise.
Always do your own due diligence. We seek safe harbor.


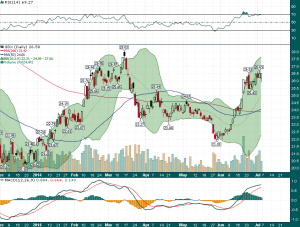
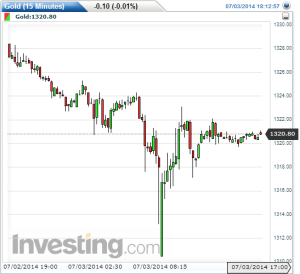
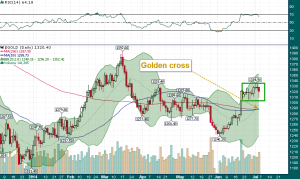
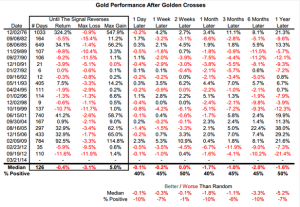
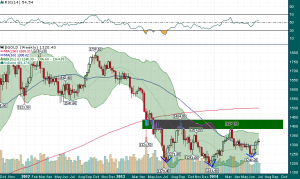


Just another head-fake to suck in all the perma-bulls………. again. Lather. Shave. Rinse. Repeat. Gold goes to $35.
Gold didn’t swoon because the “blowout jobs report” was totally bogus and filled to the brim with “seasonal adjustments”, the phony “birth & death” modeling, the adding in of part-time jobs and discounting those who fell out of unemployment to become the permanently unemployed, the hiding of the off-shored manufacturing and now trying to double-count a product to boost GDP (if it is produced in China but by an American company – you can count it twice)…nice try. The official U-3 the rate does not count discouraged workers who, unable to find a job, cease looking. To be counted among the U.3 unemployed, the person must have actively looked for work during the four weeks prior to the survey. The U.3 rate automatically declines as people who have been unable to find jobs cease trying to find one and thereby cease to be counted as unemployed. There is a second official measure of unemployment that includes people who have been discouraged for less than one year. That rate, known as U.6, is seldom reported and is double the official bogus 6.1% rate. Since 1994 there has been no official measure that includes discouraged people who have not looked for a job for more than a year. Including all discouraged workers with the bogus U-3 and the hardly mentioned U-6 rates, produces an unemployment rate that currently stands at 23.1%, almost four times the rate that the financial press reports.
If the Feds and the Central Banks and the London Fix(ers) didn’t monkey wrench paper gold almost every day (and sometimes twice a day) to drive the price down – one can barely guess what astronomical number gold would be trading at. $5000 an ounce? $10,000 an ounce?
Unlike during 2008, global financial leverage has increased 40% to $100 trillion. This record leverage is manageable only because interest rates are held artificially low. Raise rates and kaboom…