A fantastic article on silver production was recently published by SRSrocco Report comparing financial results and production levels from the 12 primary silver producers to previous results. I won't spoil it for you but the analysis reveals a couple of alarming trends for silver producers.
The Primary Silver Mining Industry continues to suffer from manipulated low metal prices. However, the prices of precious metals finally turned around today and are trading higher as the broader markets get hammered — a welcome change.
According to company results, the top 12 primary silver miners' (in my group) overall production increased substantially in Q2 2014 compared to the previous quarter. Profits, however, declined.
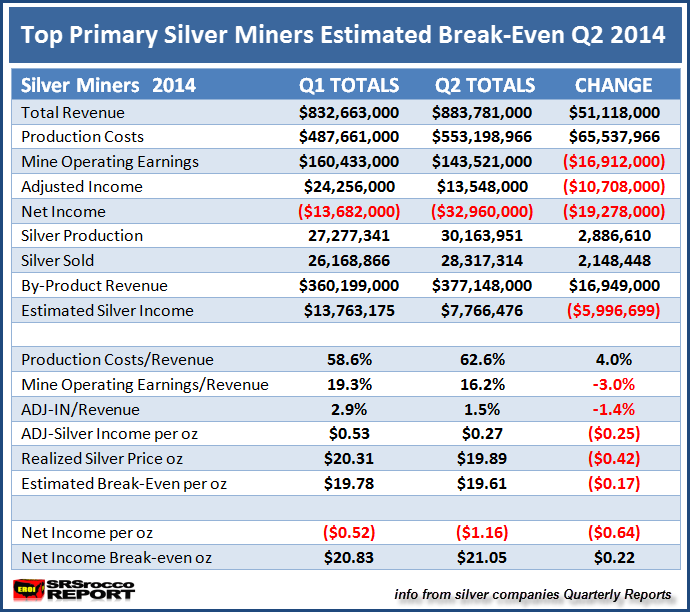
The table below compares the Q1 vs Q2 2014 combined financial metrics and estimated break-even of these top 12 primary silver mining companies:
You will notice that total revenue increased from $832 million in Q1 to $883 million in Q2. Unfortunately, production costs increased substantially as well, cutting into mine operating income. Total production costs increased from $487 million in Q1 to $553 million in the second quarter.
Higher operating costs were due to an increase of 2.9 million oz of production, as well as costs associated with Silver Standard’s new Marigold mine (primary gold mine). The Marigold mine added $24.7 million of production costs to the group's total in Q2.
Even if we removed Marigold’s share of the costs from the group, total production costs still increased $47 million quarter over quarter. This negatively impacted the group’s mine operating earnings which fell from $160 million in Q1 to $143 million in the second quarter.
The top primary silver miners increased production 2.9 million ounces and sold an additional 2.1 million oz in Q2 versus Q1. However, overall adjusted income declined from $24 million to $13 million, largely because Couer suffered a $36 million adjusted income loss during the quarter.
That is a substantial loss for one of the largest silver mining companies in the group. Coeur suffered adjusted income losses for at least the past five quarters which negatively impacted its estimated breakeven and its stock price. Matter-a-fact, Coeur’s share price has declined more in percentage terms than most of the other companies.
You will notice the average realized silver price for the group declined from $20.31 in Q1 to $19.89 Q2, while the estimated breakeven fell $0.17 from $19,78 to $19.61. Even though the estimated breakeven still declined in the second quarter of 2014, I doubt we will see much of a reduction going forward.
Comparing the Primary Silver Miners Q3 2012 to Q2 2014
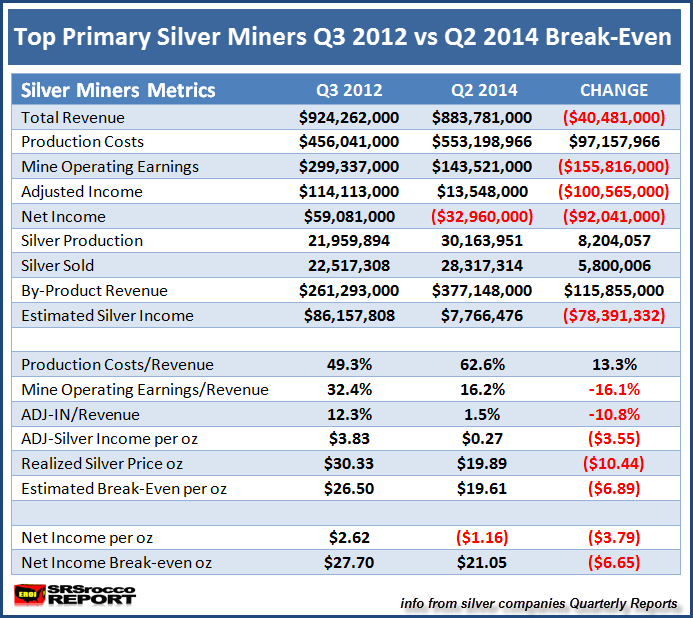
The REAL DAMAGE to the silver miners can be seen by comparing the financials going back two years… when the average price of silver was $31.15. The table below shows the miners Q3 2012 results and how they match up with the latest quarter (Q2 2014).
What a difference two years makes. Just look at the change in the group’s total revenue of $924 million in Q3 2012 compared to $883 million Q2 2014. That might not seem like a lot until we consider the group’s silver production ramped-up a staggering 8.2 million oz over this time period, while the amount of silver sold increased 5.8 million oz.
Furthermore, total mine operating earnings were more than double at $299 million in Q3 2012 versus the $143, this past quarter. Also, the group’s adjusted income declined from $114 million to a paltry $13 during this same time period.
If we look at the production cost ratio to revenues, it increased from 49.3% in Q3 2012 to 62.6% in Q2 2014. This severely impacted the bottom line for these companies. The average realized price of silver for the group was $30.33 in Q3 2012, $10.44 higher than the $19.89 the miners received in Q2 2014.
Due to serious cost cutting, the top primary silver miners were able to reduce their estimated breakeven by $6.89 in the past two years from $26.50 in Q3 2012 to $19.61 in Q2 2014. As I mentioned earlier, I highly doubt the estimated breakeven for the group will decline much going forward.
Proof of this is shown in the first table above. The estimated break-even only declined $0.17 from Q1 to Q2 2014, compared to the big drop of $6.89 from Q3 2012 to Q2 2014.
Eleven of the twelve miners stated positive adjusted incomes in Q3 2013, versus six in Q2 2014. That being said, only one of the group’s silver miners can show a profit at the current $17 price of silver… the rest would suffer losses (and some BIG LOSSES).
To summarize the change from Q3 2012 to Q2 2014, the top primary silver miners total revenue decreased $44 million, production costs increased $97 million, while adjusted income declined $100 million as the group’s silver production shot up 8.2 million oz. The group enjoyed an estimated $3.83 silver income profit per ounce in Q3 2012 versus the $0.27 in Q2 2014.
Basically, the miners produced 37% more silver only to see their total revenues decline while their adjusted income fell an amazing 88% over this two-year period. And remember… this was at an average realized price of silver at $19.89. Can you imagine what the losses will be at $17??
I will be putting out a detailed SILVER MINERS REPORT that examines individual company data, estimated breakeven and analysis including the positive and negative performance of the share prices of these stocks. I was actually surprised by the results.
--------------------------------------------------------------------------------------------------------------------------------------------------------
Article republished with permission from the SRSrocco Report.


