Earlier this week, I had the pleasure to appear on Jim Puplava’s Financial Sense Newshour radio program and discuss the state of the gold market. Along with my peers John Doody of the Gold Stock Analyst and Ross Hansen of Northwest Territorial Mint, I shared my thoughts on how we arrived in the current bear market, what factors might help us get out of it and the role real interest rates play in prices.
Below I’ve highlighted a few of my responses to Jim’s questions.
Q: Let’s begin with the bear market that began in 2011. Two questions I’d like you to answer. Number one: What do you believe caused it? Number two: Do you think this is cyclical or a secular bear market?
 A: As I often say, two factors drive gold: the Love Trade and the Fear Trade.
In 1997 and 1998, the bottom of the emerging market meltdown took place. Four years later, we saw China and Asia starting to take off and GDP per capita rise. This is an important factor in this whole run-up that I would characterize as the Love Trade. A strong correlation is rising GDP per capita, and in China, India and the Middle East, they buy gold and many gifts of love.
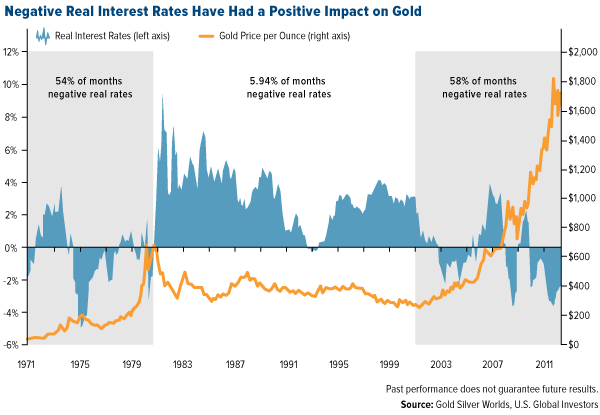
We saw the Fear Trade starting to take place after 9/11. The biggest factor behind the Fear Trade is negative real interest rates. So when you had both—negative real interest rates and rising GDP per capita in the emerging countries—you had gold demand going to record numbers.
At the very peak of 2011, the dollar had just been basically downgraded by Moody’s and we had negative interest rates on a 10-year government bond. It was a record negative real rate of return, like in the ‘70s. You saw this spending from the Fear Trade, but this Love Trade was in negative real interest rates.
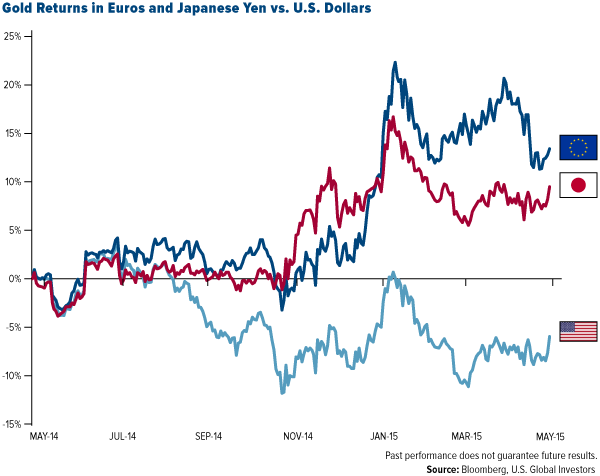
Since then, the U.S. has gone positive. But we’re seeing that in Europe, gold is taking off in euro terms, and in Japan it’s taking off in yen terms. They’re running at negative real interest rates the way we were on a relative basis up to 2011.
Q: So would you define this bear market as a cyclical bear market, a correction in a long-term trend, or would you define it as secular very much in the way that we experienced the price of gold between, let’s say, the 1980s and 1990s?
A: I think that we’re wrestling with something else. When we look at the other basic metals, what drives the demand for iron, copper, anything that makes steel? It’s fiscal policies. Huge infrastructure spending and fiscal policies. What’s happened since 2011—and after the crash of 2008 but particularly in 2011—is that when the G20 central bankers get together, they don’t talk about trade. It’s all about tax and regulation. They have to keep interest rates low to try to compete, to try to get exports up, to drive their economies. That is a big difference on the need for all these commodities, and it seems to have ended the bull market. Until we get global fiscal policies up and increase infrastructure building, then I have to turn around and look the other way, and say it’s going to take a while.
I do think that gold is going through a bear market. A lot of it has to do more with the central bankers and everything they try to do to discredit gold as an asset class, at the same time try to keep interest rates low to keep economic activity going strong. That’s been a much different factor in driving the price of gold.
The other thing that’s been fascinating is this shift of gold from North America to Switzerland to China. The Chinese have a strategy for the renminbi. Not only do they have 200 million people buying gold on a monthly program throughout their banking system, but the government is buying gold because it needs to back the renminbi to make it a world-class currency of trade.

Q: Explain two things: one, why we never saw the hyper-inflation that people thought we were going to see with the massive amounts of quantitative easing (QE), and two, investor preferences changing from hard assets into stocks.
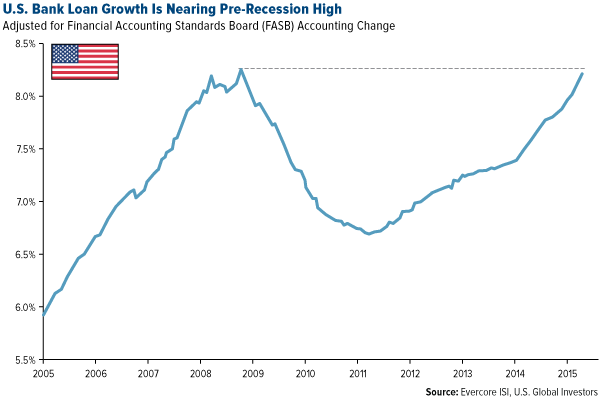
A: Well first of all, a lot of money didn’t really go directly into the economy. We never had a huge spike in credit supply in 2011, ’12, ’13. Only in ’14 did we start to see it really pick up.
We never got this big inflation some expected because the money is so difficult, outside of getting a car loan or an extension on a house. Even Ben Bernanke, after he left the Federal Reserve, had trouble refinancing his house following his own procedures. It’s extremely onerous to get a loan.
I think the biggest part is to follow the money. And where is the money going? It’s showing up in stocks. When I look at gold stocks, it’s amazing to see that the indexes are down since 2011, but a basket of the royalty companies is positive. So why is money finding its way to them? What are the factors driving that? Well, not only do they have free cash flow, but they also have a higher profit margin and they’ve been raising their dividends. Franco-Nevada again just raised its dividend. Since 2011, the dividend yield on Franco-Nevada and Royal Gold has been higher than a 5-year government bond and many times higher than a 10-year government bond. So money all of a sudden starts going for that yield and growth.
Q: What’s happened to the industry since the downturn began in 2011?
A: Well, when you take a look at the big run we had until 2006, we had very strong cash flow returns on invested capital. We had expanding free cash flow. And then a lot of the mining companies lost their focus on growth on a per-share basis. They kept doing these acquisitions, which made a company go from “$1 billion to $2 billion in revenue.” However, the cost of that meant that there was less gold per share in production and there were less reserves per share. You had this run-up in the cost for equipment, for exploration, for development. The result was you had seven majors lose their CEOs. And in the junior to mid-cap size, you probably had another 20 in which management was thrown out.
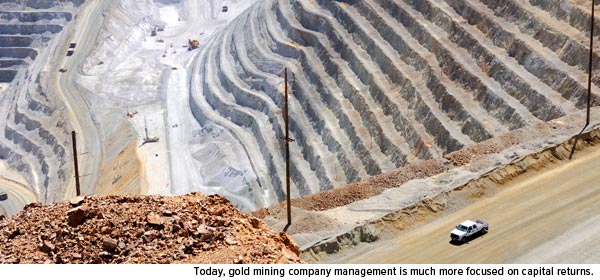
The new management is much more focused on capital returns. They have to be. Otherwise they get criticized. That will hold a lot of these managements accountable, and I think that’s very healthy. And now it’s starting to show up that the returns on capital are improving for several of these companies.
Q: What would you be doing with money right now if you were to be in the gold market? How much would you put in the gold market? How would you have that money invested.
A: I’ve always advocated 10 percent and rebalance every year. Five percent would go into gold bullion, coins, gold jewelry—you travel around the world and you can buy gorgeous gold jewelry at basically no mark-up compared to the mark-up on Fifth Avenue. The other 5 percent is in gold stocks, and if it’s a basket of these royalty companies, I think you’ll do well over time, and you rebalance.
If not, then you go to an active manager, like we have. Speaking from a buyer’s position, Ralph Aldis— portfolio manager of our Gold and Precious Metals Fund (USERX) and World Precious Minerals Fund (UNWPX)—is a TopGun ranked in Canada as an active manager.
Q: Explain your caution in terms of gold in the percentage you recommend.
A: I’ve always looked at gold as being a hedge from the imbalance of government policies. Having that 10-percent weighting and rebalancing every year might help protect your overall portfolio. There are many studies going back 30 years that show that rebalancing helps.
It’s also advisable to put half your money in dividend-paying blue chip stocks that are increasing their revenue. When there are great years in the stock market, people often take some profits. And when gold’s down, as it is now, it might be time to put money in gold and gold equities.
For more, listen to the entire interview.
Please consider carefully a fund’s investment objectives, risks, charges and expenses. For this and other important information, obtain a fund prospectus by visiting www.usfunds.com or by calling 1-800-US-FUNDS (1-800-873-8637). Read it carefully before investing. Distributed by U.S. Global Brokerage, Inc.
Past performance does not guarantee future results.
Gold, precious metals, and precious minerals funds may be susceptible to adverse economic, political or regulatory developments due to concentrating in a single theme. The prices of gold, precious metals, and precious minerals are subject to substantial price fluctuations over short periods of time and may be affected by unpredicted international monetary and political policies. We suggest investing no more than 5% to 10% of your portfolio in these sectors.
Diversification does not protect an investor from market risks and does not assure a profit.
There is no guarantee that the issuers of any securities will declare dividends in the future or that, if declared, will remain at current levels or increase over time. Note that stocks and Treasury bonds differ in investment objectives, costs and expenses, liquidity, safety, guarantees or insurance, fluctuation of principal or return, and tax features.
The S&P 500 Stock Index is a widely recognized capitalization-weighted index of 500 common stock prices in U.S. companies.
Investing in real estate securities involves risks including the potential loss of principal resulting from changes in property value, interest rates, taxes and changes in regulatory requirements.
Fund portfolios are actively managed, and holdings may change daily. Holdings are reported as of the most recent quarter-end. Holdings in the Gold and Precious Metals Fund and World Precious Minerals Fund as a percentage of net assets as of 3/31/2015: Allied Nevada Gold Corp. 0.00%; Barrick Gold Corp. 0.06% in Gold and Precious Metals Fund, 0.06% in World Precious Minerals Fund; The Coca-Cola Co. 0.00%; Franco-Nevada Corp. 0.10% in Gold and Precious Metals Fund, 0.01% in World Precious Minerals Fund; Market Vectors Gold Miners ETF 0.00%; Market Vectors Junior Gold Miners ETF 0.00%; Nestle SA 0.00%; Newmont Mining Corp. 1.10% in Gold and Precious Metals Fund, 0.06% in World Precious Minerals Fund; Osisko Gold Royalties Ltd. 7.13% in Gold and Precious Metals Fund, 10.29% in World Precious Minerals Fund; The Proctor & Gamble Co. 0.00%; Royal Gold Inc. 2.52% in Gold and Precious Metals Fund, 1.00% in World Precious Minerals Fund; SPDR Gold Shares 0.37% in Gold and Precious Metals Fund; Yamana Gold Inc. 0.87% in Gold and Precious Metals Fund, 0.23% in World Precious Minerals Fund.
All opinions expressed and data provided are subject to change without notice. Some of these opinions may not be appropriate to every investor. By clicking the link(s) above, you will be directed to a third-party website(s). U.S. Global Investors does not endorse all information supplied by this/these website(s) and is not responsible for its/their content.

