Economic geologist Brent Cook, who runs the respected Exploration Insights service, showed us why he's the best newsletter writer in junior mining in a June 16, 2013 report on Pretivm Resources (TSX:PVG). Cook dissected Pretivm's Brucejack deposit for subscribers, communicating grade continuity concerns. He explained that he'll be staying on the sidelines with regards to investing in Pretivm until results from that company's 10,000 tonne bulk sample test are public (scheduled for Q4 2013).
Today, with the announcement that Strathcona Mineral Services has resigned from their part of Pretivm's bulk sample program, the market gave a glimpse as to Pretivm's vulnerability, with shares in the company falling over 30% on the day.
Here's the Pretivm chart since Cook's call showing caution pays:
With Brent's permission, here's his June 16, 2013 analysis on Pretivm in its entirety:
Exploration Insights - June 16th, 2013
By Brent Cook
Pretium Resources Inc. (PVG.T) was brought to your attention in EI April 14, 2013 under the heading “best of the best”. We noted the exceptional high grade drill intersections and, although we desperately wanted to buy PVG (high grade, good jurisdiction, strong management, cashed up) and sincerely hope it all works, we held off buying until the results of a 10,000 tonne bulk sample are released. This week, PVG published the results of a feasibility study prepared by Tetra Tech on its Brucejack gold deposit in British Columbia.
The study envisioned an underground operation processing ~980,000 tonnes of ore per year, with gold production ramping up from an initial 270,000 ounces per year to 425,700 before reaching a life of mine average of 321,500, for a total of 7.1 million ounces. Capex came in at $663 million (including contingencies) and all-in sustaining cash costs came in at a very respectable $508 per ounce. At a base case using $1,350 gold and $20 silver, the study reported a pre-tax NPV5% of US$2.7 billion and an IRR of 42.9% (post-tax $1.76b, 35.7%IRR). Dropping precious metal prices to $800 gold and $15 silver produces a pre-tax NPV5% $602 million and IRR of 16.6% (post-tax $383.7m, IRR 13.7%). With gold at $1,415 and silver at $22.70, the study shows a pre-tax NPV5% of $3 billion and IRR of 41% (post-tax $1.98b, IRR 39.2%). Pretium’s current market capitalization is ~$844 million.
The feasibility study was based on probable reserves of 6.6 million ounces grading 13.6 grams per tonne gold from the Valley of the Kings deposit, plus 700,000 ounces from the much less significant West Zone. All fine and dandy, but somewhat a case of putting the horse before the cart as the really big unknown here is if the hard rock reality matches the probabilistic resource estimate from which the reserve was derived.
The gist of the following detailed commentary is that, it may or may not, and I prefer to watch from the sidelines.
The Brucejack Deposit
The Brucejack reserve estimate, prepared by Snowden, employed ordinary, indicator, and multiple indicator Kriging methods to geostatistically produce a nicely smoothed, high grade deposit. The estimate is based on a probabilistic model that effectively implies, “We don’t really know where the high grade is, specifically, but predict it will probably be somewhere within the broad low grade halo.” This uncertainty reflects the nature of the mineralization, where the very high grade occurs in narrow discontinuous gashes or stockworks that from the available data are nearly impossible to connect with certainty from drill hole to drill hole (see pg. 21 from the June, 2013 presentation on Pretium’s home page). The erratic (unpredictable) nature of the high grade mineralization is apparent on a broad scale in the screenshot of a cross section through the deposit, below (Fig. 1).
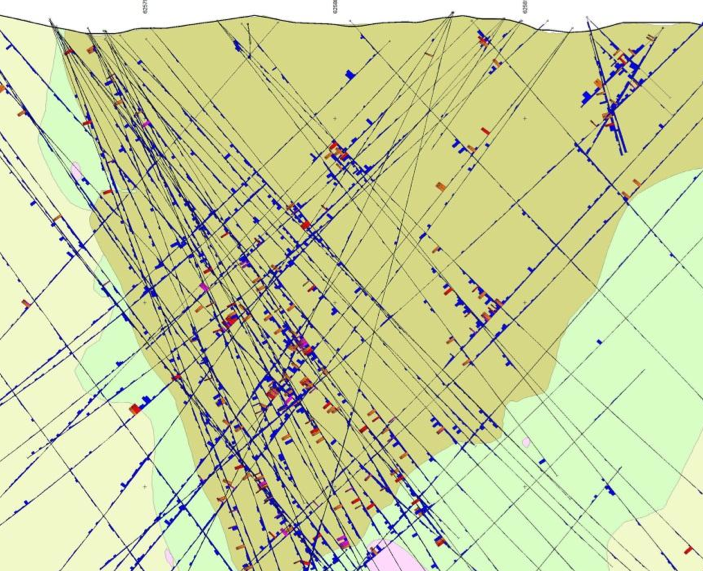
(Fig. 1: Cross section 426625E containing drill traces and assay histograms from an 80m wide zone showing gold intercepts. Orange: 5 to 15g/t; red: 15 to 100g/t; magenta: >100g/t. Field of view ~150 meters. Can you connect the dots?)
Gold grades within the Valley of the Kings deposit are highly skewed, so much so that the very high grade (greater than 429g/t Au) accounts for 0.8% of the tonnes but 25% of the total ounces. Looked at another way, 96% of the indicated ounces are contained in just 8.2% of the tonnes (Fig. 2 below). The majority of the assays within the resource are in the 0.75 to 2 grams per tonne gold range and average 0.67 grams per tonne gold. However, the reserve is based on a 5 gram per tonne cutoff, meaning that if an underground blast being hauled to the mill does not have the high grade component predicted, it is probably uneconomic to mine (waste). But here’s the kicker: very tight underground drilling or even mine face sampling may not catch the probabilistically predicted high grade. No one will know what’s in the rock until it is mined and processed; hence our keen interest in the 10,000 tonne bulk sample.
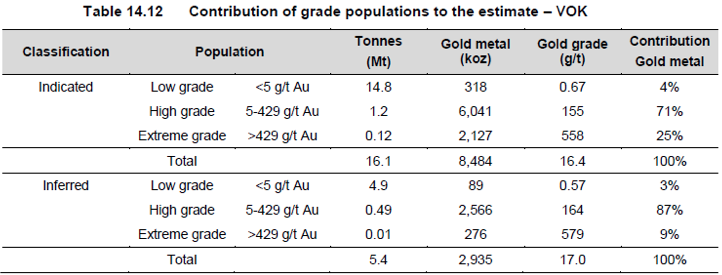
(Fig. 2: Breakdown of resource tonnes by grade and contained gold. 1.32 tonnes contain 8.16 mil oz and 14.8 tonnes contain 318k oz.)
The global resource model may be correct, but at the local level the model often does not correlate well with the drill data. This observation is evident in the image below (Fig. 3) showing a cross section through a portion of the model. The red outline is the mineralized domain resource boundary, which is an approximate 1 gram per tonne shell (within this single shell are gold grades of over 1,000 grams per tonne). Besides the geostatistics, there were no other controls on the estimate within the domain. The color coding of the blocks and drill holes shows values from 2-5g/t Au in red and >5 g/t Au in magenta. In the image you can see that there is a large patch of red and magenta blocks that are being driven by three very thin high grade zones in two holes. These thin drill intercepts represent the mineralized veins, which are really the only features of economic interest. But these high grades are spread over a large volume in the estimate and may result in too many tonnes and a false picture of the deposit, both spatially and regarding grade.
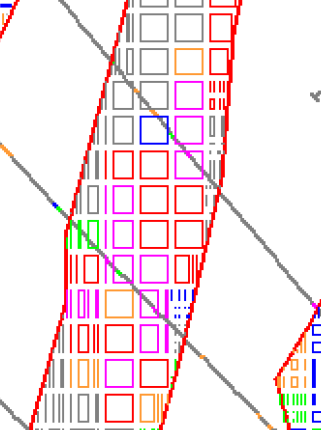
(Fig. 3: Screenshot from a portion of a cross section showing estimated gold grades for resource blocks compared to input composites and drill hole traces within mineralized VOK domains. Source here, pg. 92)
The company is currently accessing the deposit underground, and is in the process of preparing to collect the aforementioned bulk sample in a program being supervised by Strathcona and Snowden. The area being tested was carefully selected to be as representative of the high grade deposit as possible. The underground drill program consists of tightly spaced fan drilling from ~18 stations (9 north, 9 south for 190 holes) along an ~120 meter zone from which the bulk sample will be mined. The bulk sample will be collected from 3.5 by 4 meter rectangular drifts concurrently (as illustrated in the June 2013 PVG presentation). Drill results released from the first underground drill fan (Fig. 4 below) demonstrate the expected erratic nature of the high grade mineralization and, according to the company, these results are as expected from the “probabilistic” model and continue to confirm the projection of the high grade mineralized domains.
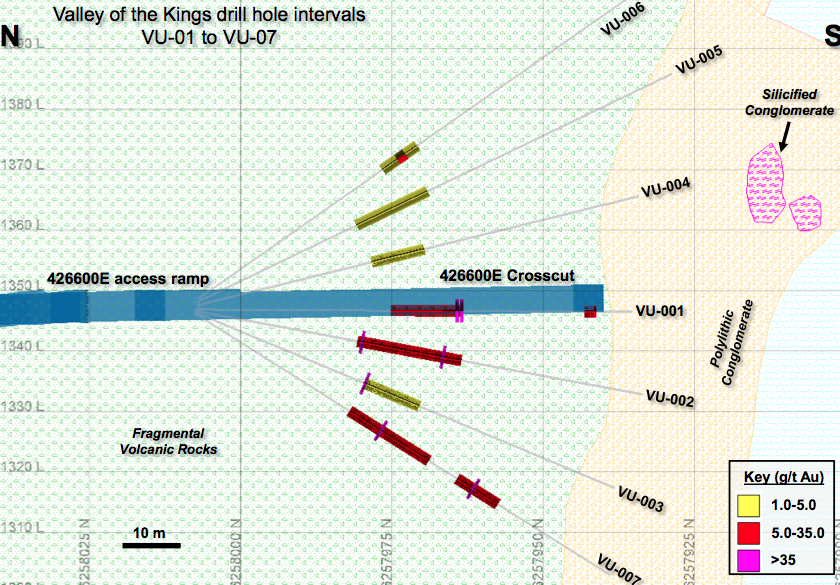
(Fig. 4: Cross section showing underground drill trace and reported mineralized intervals. Histograms show location of high grade intersections)
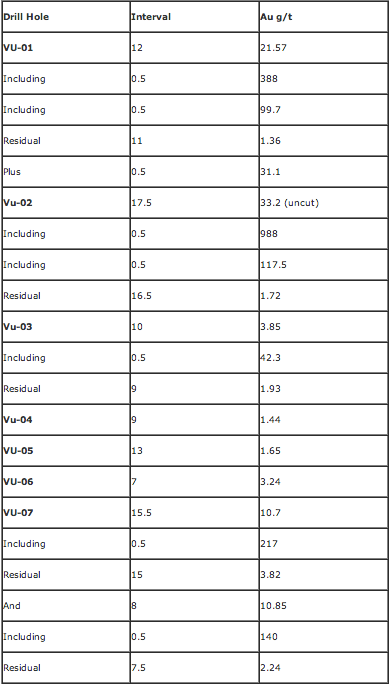
Regarding the June 6 news release, of the seven holes drilled from a single underground set up, four of the holes intersected a total of seven narrow (0.5m) intervals of very high grade within the resource domain being tested. The results are presented in the table below, which also notes the residual grade of the intersection, excluding the high grade hits. What the table shows is that the bulk of the drill assays reported grade around 1 to 2 grams per tonne gold--apparently as modeled.
It is worth pointing out that these are selected intervals from within approximately 50 meters of drill core, the majority of which, apparently, did not meet the criteria for inclusion in the news release. As I understand it, the modeled resource that will eventually be mined (post bulk sample) includes roughly everything from about the 6258000N line to the beige colored conglomerate contact (Fig. 3). Most of the drill core assayed, but not reported, probably ran between 0.75 and 2 grams per tonne gold: in line with the resource model but devoid of the very high grade gashes.
Conclusion
Valley of the Kings is an example of an extreme lognormal (bimodal+) gold deposit in which a relatively few very high grade assays drives the resource estimate and carries the deposit. The deposit’s geological and structural complexity makes it virtually impossible to precisely predict where the economic gold grades will occur on the drill hole scale. It is quite likely that any of the holes noted above would produce significantly different results if located a mere few meters away. This unpredictability, in real space, becomes worrisome at the mining stage where miners don’t mine probabilistically: the rock in the ore car is either ore or waste. The problem can continue to the mill where the bulk of the tonnes may, or may not, be sub-economic and the whole operation is carried by the very few high grade and largely unpredictable tonnes that occur at irregular intervals.
The feasibility study, although quite promising, is underpinned by a resource model that is, in turn, based on unpredictability. The actual mined grades could be 5 or 20 grams per tonne as far as I can tell. Although the results of the 10,000 tonne bulk sample will, in reality, only be representative of the area tested, these results should provide us with a much better understanding of how the deposit relates to the resource model, how it might behave, and what the grades are more likely to be (relative to the resource model).
Pretium should be releasing additional underground drill results as they become available, with the bulk sample results expected later in the year after all the data has been compiled. There is an official analyst tour scheduled for next week. We will monitor those results and analyst commentary while waiting on the bulk sample findings.
That’s the way I see it.
Brent Cook
[Ed. note: Cook's weekly Exploration Insights letter is worth every penny of its $140 per month.]


