Visual Capitalist
Articles by Visual
POSTED ON June 24, 2015 BY Visual Capitalist

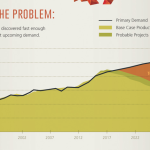
The Looming Copper Supply Crunch This infographic is presented by Western Copper & Gold Copper is among the three most used metals in the world, and high quantities of the red metal must be mined every year to meet global demand. The market for copper is equal to approximately $120 billion each year, which rivals… Continue Reading

POSTED ON December 16, 2013 BY Visual Capitalist

In 2008, the aftermath of the Subprime Mortgage Crisis created the perfect storm for the emergence of Bitcoin. Here is all five years of history for the famous crypto-currency. Click the image to view the full-sized infographic.

POSTED ON December 11, 2013 BY Visual Capitalist

>>From the VC Market Trends Blog It is often said that history doesn’t repeat itself, but it does rhyme. Bitcoin, in just nine months, has done something absolutely tremendous in that respect. Even by just checking out sites like Bitcoin.co.uk, seeing how much of an impact Bitcoin has had and continues to do so for… Continue Reading

POSTED ON November 25, 2013 BY Visual Capitalist

How Rare are 1 million+ oz gold deposits? A Meticulous Examination of Existing and Future Gold Supply – Click here to see the full infographic from Visual Capitalist

POSTED ON September 19, 2013 BY Visual Capitalist

Global demand for platinum as an investment has increased 30x since 2003. Learn about platinum’s investment potential in Part 3 of The Platinum Series. VC Infographic | Platinum Series: Platinum as an Investment http://t.co/7AcI5FCrnu — Visual Capitalist (@VisualCap) September 19, 2013

POSTED ON September 05, 2013 BY Visual Capitalist

While gold and platinum are almost equally as rare, the amount of platinum mined through history is only a mere fraction.  Learn about the history of platinum in the first part of The Platinum Series. Full infographic on the Visual Capitalist website.  

POSTED ON August 13, 2013 BY Visual Capitalist

Nuclear power is a clean energy source that will be used well into the future to help meet the world’s growing energy requirements. In this infographic, Visual Capitalist highlights uranium’s history, properties, and fundamentals moving forward. Uranium: The Metal of Tomorrow Nuclear power accounts for 5.7% of the world’s energy and 13% of the world’s… Continue Reading

POSTED ON August 06, 2013 BY Visual Capitalist

Visual Capitalist has taken on uranium in Saskatchewan’s Athabasca Basin in their latest infographic. Sprott USA Chairman Rick Rule calls the Basin, “The Persian Gulf of Uranium.” Read our past coverage of exploration companies in the area. Source.

POSTED ON July 23, 2013 BY Visual Capitalist

Visual Capitalist’s Tickerscores, which allows investors to compare precious metals stocks head-to-head, gave 46% of BC Gold & Silver Miners in the development stage a failing grade. Tickerscores uses 20+ variables and rates companies based on financials, management, valuation, recent performance, and project potential. The following infographic displays the highlights for 28 BC development companies. To… Continue Reading

×